
UNITED STATES
SECURITIES AND EXCHANGE COMMISSION
Washington, D.C. 20549
FORM 8-K
CURRENT REPORT
Pursuant to Section 13 or 15(d) of The Securities Exchange Act of 1934
Date of Report (Date of earliest event reported): October 21, 2026
(Exact name of registrant as specified in its charter)
| (State of Incorporation) | (Commission File Number) | (I.R.S. Employer Identification No.) | ||||||||||||
| | ||||||||||||||
| (Address of principal executive offices) | (Zip Code) | |||||||||||||
(Registrant’s telephone number, including area code): (305 ) 569-2000
Check the appropriate box below if the Form 8-K filing is intended to simultaneously satisfy the filing obligation of the registrant under any of the following provisions:
Securities registered pursuant to Section 12(b) of the Act:
| Class | Trading Symbol | Name of Exchange on Which Registered | ||||||||||||
Indicate by check mark whether the registrant is an emerging growth company as defined in Rule 405 of the Securities Act of 1933 (§230.405) or Rule 12b-2 of the Securities Exchange Act of 1934 (§240.12b-2).
Emerging growth company ☐
If an emerging growth company, indicate by check mark if the registrant has elected not to use the extended transition period for complying with any new or revised financial accounting standards provided pursuant to Section 13(a) of the Exchange Act ☐
Item 2.02 Results of Operations and Financial Condition.
On October 21, 2026 , BankUnited, Inc. (the “Company”) reported its results for the quarter ended September 30, 2026. A copy of the Company’s press release containing this information and slides containing supplemental information related to this release are being furnished as Exhibit 99.1 and Exhibit 99.2, respectively, to this Current Report on Form 8-K and are incorporated herein by reference.
Item 9.01 Financial Statements and Exhibits.
(d) Exhibits.
| Exhibit Number | Description | ||||||||||
2
SIGNATURE
Pursuant to the requirements of the Securities Exchange Act of 1934, the registrant has duly caused this report to be signed on its behalf by the undersigned hereunto duly authorized.
| Dated: | BANKUNITED, INC. | ||||||||||
/s/ James G. Mackey | |||||||||||
| Name: | James G. Mackey | ||||||||||
| Title: | Chief Financial Officer | ||||||||||
3
4
Exhibit 99.1

BankUnited, Inc. Reports 3Q 2026 Net Income of $72 million, $1.01 Diluted EPS;
Excluding Impact of Securities Sales, Net Income of $74 million, $1.03 Diluted EPS
Continued Franchise Momentum Drives NIM Expansion, Stronger Funding Mix and Improved Credit Trends
Miami Lakes, Fla. — October 21, 2026 — BankUnited, Inc. (the “Company”) (NYSE: BKU) today announced financial results for the quarter ended September 30, 2026.
Chairman, President and Chief Executive Officer Rajinder Singh commented, "We delivered another quarter of solid performance, with continued deposit momentum and net interest margin expanding to 3.16%, ahead of our guidance. Benefiting from a strong economy, we remain focused on increasing profitability and creating long-term shareholder value."
| Third Quarter Financial Highlights | |||||
| Quarter Ended | Change From | ||||||||||||||||||||||||||||
| ($ in millions except per share data) | 3Q26 | 2Q26 | 3Q25 | 2Q26 | 3Q25 | ||||||||||||||||||||||||
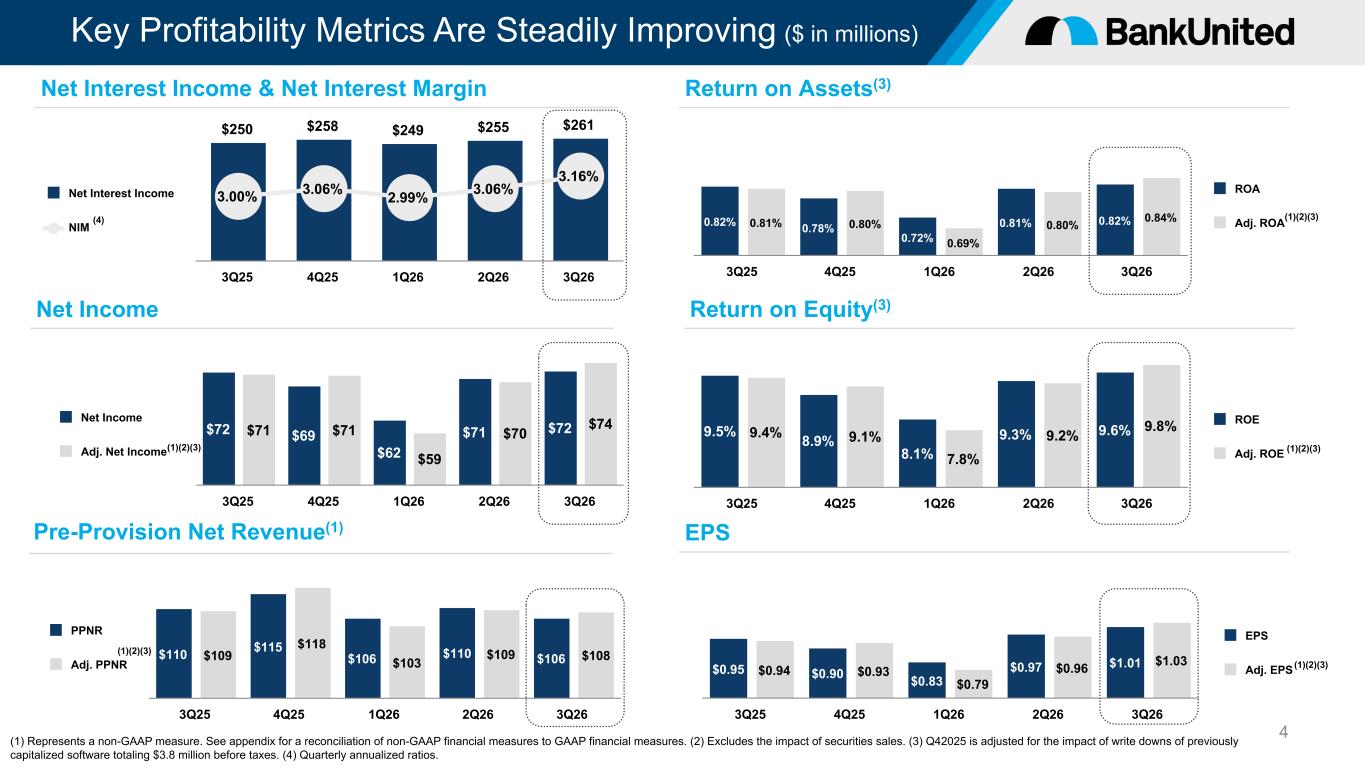
| Net Income | $ | 72.2 | $ | 70.7 | $ | 71.9 | $ | 1.5 | $ | 0.3 | |||||||||||||||||||
| Adjusted Net Income1,2 | $ | 73.9 | $ | 70.0 | $ | 71.4 | $ | 3.9 | $ | 2.5 | |||||||||||||||||||
| Diluted EPS | $ | 1.01 | $ | 0.97 | $ | 0.95 | $ | 0.04 | $ | 0.06 | |||||||||||||||||||
Adjusted Diluted EPS1,2 | $ | 1.03 | $ | 0.96 | $ | 0.94 | $ | 0.07 | $ | 0.09 | |||||||||||||||||||
PPNR1 | $ | 105.9 | $ | 109.9 | $ | 109.5 | $ | (4.0) | $ | (3.6) | |||||||||||||||||||
ROA3 | 0.82 | % | 0.81 | % | 0.82 | % | 0.01 | % | — | % | |||||||||||||||||||
ROE3 | 9.6 | % | 9.3 | % | 9.5 | % | 0.3 | % | 0.1 | % | |||||||||||||||||||
| Net Interest Margin3 | 3.16 | % | 3.06 | % | 3.00 | % | 0.10 | % | 0.16 | % | |||||||||||||||||||
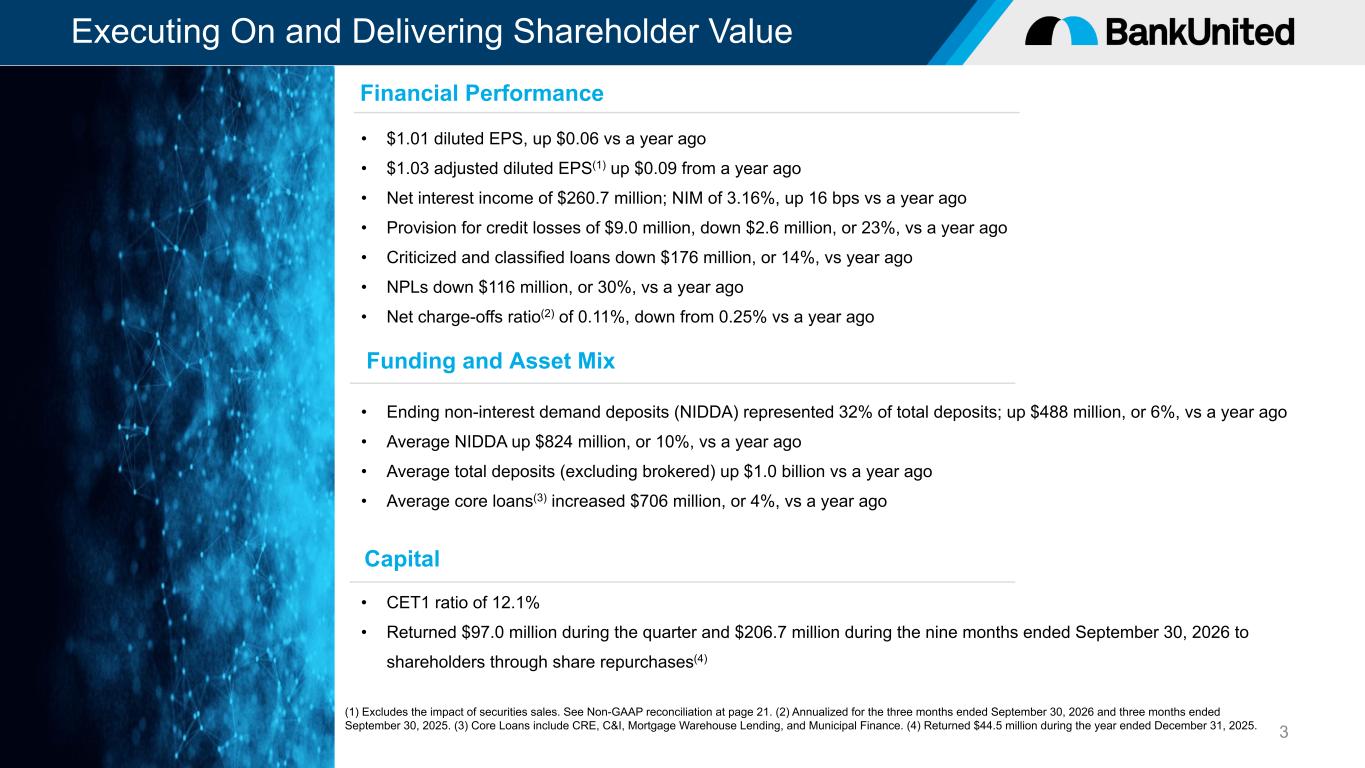
| Performance Highlights | •Net Interest Margin (NIM) of 3.16%, up 16 bps from a year ago and up 10 bps from prior quarter. | ||||
•Diluted EPS of $1.01, up $0.06 from a year ago and $0.04 from prior quarter. | |||||
•Adjusted Diluted EPS1, 2 of $1.03, up $0.09 from a year ago and $0.07 from prior quarter. | |||||
•Approximately 2.1 million shares repurchased in Q3 for an aggregate of $97.0 million. | |||||
| Deposits | •Non-Interest Demand Deposits (NIDDA): | ||||
◦Average NIDDA up $824 million, or 10%, from a year ago and remained stable from prior quarter, continuing to serve as a key funding source despite ending balance fluctuations. | |||||
◦Ending NIDDA up $488 million, or 6%, from a year ago and down $821 million, or 8%, from prior quarter primarily due to seasonal normalization following elevated inflows in Q2. | |||||
◦Represents 32.2% of total deposits, up from 30.1% a year ago. | |||||
•Average Total Deposits (excluding brokered): Up $1.0 billion from a year ago and down $385 million from prior quarter. | |||||
| Loans | •Average Core Loans increased $706 million, or 4%, from a year ago and decreased $147 million, or 1%, from prior quarter. | ||||
•Total Average Loans remained stable from a year ago and decreased by $314 million from the prior quarter due to continued purposeful runoff in non-core loans. | |||||
| Credit | •Criticized and Classified Loans decreased $176 million, or 14%, from a year ago and decreased $10 million, or 1%, from prior quarter. | ||||
•Net Charge-Offs ratio remained low, 0.11%, in both the current and prior quarter, and down from 0.25% a year ago. | |||||
•NPLs down $116 million, or 30%, from a year ago, and up $40 million, or 18%, from the prior quarter. | |||||
(1) Represents a non-GAAP measure. See "Non-GAAP Financial Measures" section for a reconciliation of non-GAAP financial measures to GAAP financial measures.
(2) Excludes the impact of securities sales.
(3) Annualized for the three months ended September 30, 2026, June 30, 2026, and September 30, 2025.
1
Net Interest Income & Margin
| Net Interest Income | Net Interest Margin (NIM) | |||||||||||||||||||
p$5.3 million or 2% from prior quarter | p $10.5 million or 4% from 3Q 2025 | p 10 bps from prior quarter | p 16 bps from 3Q 2025 | |||||||||||||||||
Net interest income and margin increased from the prior quarter due to the following factors:
•Deposit pricing continued to improve, contributing to lower funding costs; average cost of deposits improved by 6 bps to 1.99%.
•The tax equivalent yield on investment securities benefited from the sale of lower-yielding securities and reinvestment into higher-yielding securities, which improved the overall yield of the investment portfolio.
•Tax equivalent yields on commercial loans increased 5 bps from the prior quarter, reflecting favorable loan repricing and improved commercial loan portfolio mix.
Net interest income and margin also increased from a year ago due to the following factors:
•Average NIDDA grew by $824 million while average interest bearing liabilities declined by $1.0 billion; average cost of deposits improved by 39 bps from a year ago.
•Partially offset by lower tax-equivalent asset yields, as variable-rate loans and securities repriced downward faster than the benefit from lower funding costs and favorable funding mix dynamic due to lower SOFR/Fed funds basis.
Non-Interest Income and Non-Interest Expense
The following table summarizes non-interest income and non-interest expense for the periods presented (in millions):
| Three Months Ended | |||||||||||||||||
| 3Q26 | 2Q26 | 3Q25 | |||||||||||||||
| Deposit service charges and fees | $ | 6.4 | $ | 6.3 | $ | 5.4 | |||||||||||
| Gain (loss) on investment securities, net | (2.3) | 0.9 | 0.6 | ||||||||||||||
| Lease financing, net | 1.7 | 3.9 | 4.2 | ||||||||||||||
| Capital markets income | 6.3 | 8.1 | 6.3 | ||||||||||||||
| Other non-interest income: | |||||||||||||||||
| Loan service charges | 3.8 | 4.0 | 4.0 | ||||||||||||||
| Commercial card income | 1.5 | 1.8 | 1.6 | ||||||||||||||
| BOLI income | 1.1 | 3.0 | 2.5 | ||||||||||||||
| Other | 1.3 | 1.2 | 1.0 | ||||||||||||||
| Non-interest income | $ | 19.8 | $ | 29.2 | $ | 25.6 | |||||||||||
| Non-interest expense | $ | 174.6 | $ | 174.6 | $ | 166.2 | |||||||||||
•Non-interest income decreased from prior quarter and from a year ago due to the following factors:
◦Loss on sale of investment securities primarily driven by the strategic sale of lower-yielding securities of approximately $1.0 billion and the redeployment of proceeds into higher-yielding investments to improve the portfolio's earning potential.
◦BOLI income decreased $1.9 million from prior quarter and $1.4 million from a year ago reflecting less favorable market performance impacting returns on one of our policies.
◦Lease financing income decreased $2.2 million from prior quarter and decreased $2.5 million from a year ago primarily due to a $1.1 million loss on equipment disposition recognized during the quarter, compared to a $0.9 million gain in prior quarter and $0.2 million gain a year ago.
◦Capital Markets income decreased $1.8 million from prior quarter, driven by market conditions and shifts in loan production timelines.
2
•Non-interest expense remained flat compared to the prior quarter, and increased compared to a year ago primarily as a result of increases in employee compensation and deposit-related costs due to competition.
Loans
•Average CRE loans increased by $75 million, or 1%, from prior quarter and increased by $624 million, or 10%, from a year ago.
•Average C&I loans decreased by $306 million, or 4%, from prior quarter and decreased by $91 million, or 1%, from a year ago.
•Average MWL (Mortgage Warehouse Lending) loans increased by $133 million, or 18%, from prior quarter and $226 million, or 35%, from a year ago.
•Average Residential loans decreased by $151 million, or 2%, from the prior quarter and $621 million, or 9%, from a year ago; consistent with our balance sheet repositioning strategy.
Loan portfolio composition at the periods indicated are as follows (in thousands):
| 3Q26 | 2Q26 | 3Q25 | |||||||||||||||||||||||||||||||||
| Amortized Cost | Average Balance | Amortized Cost | Average Balance | Amortized Cost | Average Balance | ||||||||||||||||||||||||||||||
| Core Loan Segments: | |||||||||||||||||||||||||||||||||||
CRE 1 | $ | 7,073,374 | $ | 7,012,836 | $ | 7,006,901 | $ | 6,938,213 | $ | 6,534,615 | $ | 6,388,575 | |||||||||||||||||||||||
C&I 2 | 8,572,160 | 8,400,185 | 8,681,166 | 8,706,525 | 8,555,869 | 8,490,948 | |||||||||||||||||||||||||||||
| MWL | 932,290 | 863,798 | 876,771 | 730,841 | 709,185 | 637,663 | |||||||||||||||||||||||||||||
| Municipal Finance | 592,293 | 581,996 | 636,945 | 630,329 | 637,198 | 635,811 | |||||||||||||||||||||||||||||
| Total Core Loans | 17,170,117 | 16,858,815 | 17,201,783 | 17,005,908 | 16,436,867 | 16,152,997 | |||||||||||||||||||||||||||||
| Other | 59,342 | 63,342 | 71,740 | 78,929 | 134,635 | 140,653 | |||||||||||||||||||||||||||||
| Residential | 6,585,897 | 6,603,215 | 6,655,550 | 6,754,430 | 7,130,992 | 7,224,702 | |||||||||||||||||||||||||||||
| Total Loans | $ | 23,815,356 | $ | 23,525,372 | $ | 23,929,073 | $ | 23,839,267 | $ | 23,702,494 | $ | 23,518,352 | |||||||||||||||||||||||
Deposits
Deposit portfolio composition at the periods indicated are as follows (in thousands):
| 3Q26 | 2Q26 | 3Q25 | |||||||||||||||||||||||||||||||||
| Ending Balance | Average Balance | Ending Balance | Average Balance | Ending Balance | Average Balance | ||||||||||||||||||||||||||||||
| Non-Interest Bearing Demand | $ | 9,113,570 | $ | 9,027,447 | $ | 9,934,638 | $ | 9,027,557 | $ | 8,625,115 | $ | 8,203,439 | |||||||||||||||||||||||
| Interest Bearing Demand | 6,255,347 | 6,620,530 | 6,619,044 | 6,365,179 | 6,609,679 | 5,586,547 | |||||||||||||||||||||||||||||
| Savings and Money Market | 9,899,164 | 9,976,749 | 9,958,785 | 10,083,767 | 9,936,797 | 9,921,293 | |||||||||||||||||||||||||||||
| Time | 3,042,882 | 2,339,315 | 2,368,781 | 3,251,965 | 3,446,696 | 3,535,051 | |||||||||||||||||||||||||||||
| Total Deposits | $ | 28,310,963 | $ | 27,964,041 | $ | 28,881,248 | $ | 28,728,468 | $ | 28,618,287 | $ | 27,246,330 | |||||||||||||||||||||||
(1) Commercial real estate loans, including non-owner occupied commercial real estate and construction and land.
(2) Commercial and industrial loans, including owner-occupied commercial real estate.
3
Credit
Credit Quality
Credit quality metrics remained strong during Q3, as criticized and classified loans decreased and non-performing loans modestly increased from prior quarter.
•Criticized and Classified Loans: Decreased $10 million from prior quarter, and $176 million from a year ago.
•Net Charge-Offs: Net charge-offs for the quarter (annualized) was 0.11%, flat from prior quarter and down 0.14% from a year ago.
•Non-Performing Loans: Up $40 million, or 18%, from prior quarter and down $116 million, or 30%, from a year ago.
•NPA Ratio: 0.77%, including 0.09% related to guaranteed portion of SBA loans, up from 0.66%, including 0.09% related to SBA, in prior quarter, and down from 1.10%, including 0.11% related to SBA, from a year ago.
The following table provides a breakdown of criticized and classified loans for the periods indicated (in thousands):
| 3Q26 | 2Q26 | 3Q25 | |||||||||||||||||||||||||||||||||
| CRE | Total Commercial | CRE | Total Commercial | CRE | Total Commercial | ||||||||||||||||||||||||||||||
| Special mention | $ | — | $ | 107,247 | $ | 33,868 | $ | 175,198 | $ | 54,562 | $ | 136,640 | |||||||||||||||||||||||
| Substandard - accruing | 391,714 | 730,885 | 411,167 | 686,274 | 521,284 | 733,615 | |||||||||||||||||||||||||||||
| Substandard - non-accruing | 35,676 | 171,553 | 36,255 | 156,208 | 149,993 | 306,953 | |||||||||||||||||||||||||||||
| Doubtful | — | 39,686 | — | 41,682 | — | 48,635 | |||||||||||||||||||||||||||||
| Total | $ | 427,390 | $ | 1,049,371 | $ | 481,290 | $ | 1,059,362 | $ | 725,839 | $ | 1,225,843 | |||||||||||||||||||||||
Allowance & Provision
Allowance levels and coverage remained appropriate during the periods presented, with changes reflecting increases in certain qualitative factors and net charge-offs. The following tables summarize the ACL, key coverage metrics, and changes across the periods presented (dollars in thousands):
| ACL | ACL to Total Loans | Commercial ACL to Commercial Loans1 | ACL to Non-Performing Loans | Net Charge-offs to Average Loans2 | |||||||||||||||||||||||||
| 3Q26 | $ | 221,476 | 0.93 | % | 1.33 | % | 83.96 | % | 0.11 | % | |||||||||||||||||||
| 2Q26 | $ | 217,516 | 0.91 | % | 1.30 | % | 97.14 | % | 0.11 | % | |||||||||||||||||||
| 3Q25 | $ | 219,884 | 0.93 | % | 1.35 | % | 57.95 | % | 0.25 | % | |||||||||||||||||||
| Three Months Ended | |||||||||||||||||
| 3Q26 | 2Q26 | 3Q25 | |||||||||||||||
| Beginning balance | $ | 217,516 | $ | 208,790 | $ | 222,730 | |||||||||||
| Provision | 10,280 | 15,098 | 11,851 | ||||||||||||||
| Net charge-offs | (6,320) | (6,372) | (14,697) | ||||||||||||||
| Ending balance | $ | 221,476 | $ | 217,516 | $ | 219,884 | |||||||||||
(1) For purposes of this ratio, commercial loans includes the core C&I and CRE sub-segments as presented in the table above as well as franchise and equipment finance. Due to their unique risk profiles, MWL and municipal finance are excluded from this ratio.
(2) Annualized for the three months ended September 30, 2026, June 30, 2026, and September 30, 2025.
4
Capital, Liquidity & Shareholder Returns
Capital levels remained strong and well above regulatory requirements, providing ability to execute growth initiatives while continuing to return capital to shareholders.
•AOCI declined by $137.8 million from prior quarter and by $149.6 million compared to a year ago, reflecting higher unrealized losses on investment securities available for sale.
•CET1: 12.1%, down 20 bps from prior quarter and down 40 bps from a year ago.
•Tangible Common Equity Ratio: 8.0%, down 45 bps from prior quarter and 49 bps from a year ago.
•Tangible Book Value per Share1: $39.10, down from $40.48 in the prior quarter, while remaining essentially flat from a year ago.
Earnings Conference Call and Presentation
A conference call to discuss quarterly results will be held at 9:00 a.m. ET on Wednesday, October 21, 2026 with Chairman, President and Chief Executive Officer Rajinder P. Singh, Chief Financial Officer James G. Mackey and Chief Operating Officer Thomas M. Cornish.
The earnings release and slides with supplemental information relating to the release will be available on the Investor Relations page under About Us on www.bankunited.com prior to the call. Due to recent demand for conference call services, participants are encouraged to listen to the call via a live Internet webcast at https://ir.bankunited.com. To participate by telephone, participants will receive dial-in information and a unique PIN number upon completion of registration at https://dpregister.com/sreg/10211384/104b2a22228. For those unable to join the live event, an archived webcast will be available on the Investor Relations page at https://ir.bankunited.com approximately two hours following the live webcast.
About BankUnited, Inc.
BankUnited, Inc., with total assets of $34.6 billion at September 30, 2026, is the bank holding company of BankUnited, N.A., a national bank headquartered in Miami Lakes, Florida, with operations in Florida, New York, Dallas, Atlanta, Morristown, New Jersey, and Charlotte, North Carolina. BankUnited provides a full range of consumer and commercial banking products and services to individuals, small businesses, middle-market companies, large corporations and institutions, and offers certain commercial lending and deposit products through national platforms. For additional information, call (877) 779-2265 or visit www.BankUnited.com. BankUnited can be found on Facebook at facebook.com/BankUnited.official, LinkedIn@BankUnited and on X@BankUnited.
(1) Represents a non-GAAP measure. See "Non-GAAP Financial Measures" section for a reconciliation of non-GAAP financial measures to GAAP financial measures.
5
Forward-Looking Statements
This press release contains forward-looking statements within the meaning of the Private Securities Litigation Reform Act of 1995 that reflect the Company’s current views with respect to, among other things, future events and financial performance, dividend payments and stock repurchases. The Company generally identifies forward-looking statements by terminology such as “outlook,” “believes,” “expects,” “potential,” “continues,” “may,” “will,” “could,” “should,” “seeks,” “approximately,” “predicts,” “intends,” “plans,” “estimates,” “anticipates,” "forecasts" or the negative version of those words or other comparable words. Any forward-looking statements contained in this press release are based on the historical performance of the Company and its subsidiaries or on the Company’s current plans, estimates and expectations. The inclusion of this forward-looking information should not be regarded as a representation by the Company that the future plans, estimates or expectations contemplated by the Company will be achieved. Such forward-looking statements are subject to various risks and uncertainties and assumptions, including (without limitation) those relating to the Company’s operations, financial results, financial condition, business prospects, growth strategy and liquidity, including as impacted by external circumstances outside the Company's direct control, such as (1) an inability to successfully execute our core business strategy; (2) adverse events or conditions impacting the financial services industry, (3) our ability to access capital, including the impact of our credit rating; (4) credit risk inherent in the business of making loans and embedded in our securities portfolio, including inadequate allowance for credit losses and real estate market conditions and valuations; (5) interest rate risk, (6) liquidity risks, (7) risks related to the regulation of our industry, (8) operational risk, including dependence on information technology and third party service providers and the risk of systems failures, interruptions or breaches of security or inability to keep pace with technological change; (9) reputational risk, (10) the impact of conditions in the financial markets and economic conditions generally; (11) ineffective risk management or internal controls; and (12) the selection and application of accounting policies and methods and related assumptions and estimates. If one or more of these or other risks or uncertainties materialize, or if the Company’s underlying assumptions prove to be incorrect, the Company’s actual results may vary materially from those indicated in these statements. These factors should not be construed as exhaustive. The Company does not undertake any obligation to publicly update or review any forward-looking statement, whether as a result of new information, future developments or otherwise. A number of important factors could cause actual results to differ materially from those indicated by the forward-looking statements. Information on these factors can be found in the Company’s Annual Report on Form 10-K for the year ended December 31, 2025, and any subsequent Quarterly Report on Form 10-Q or Current Report on Form 8-K, which are available at the SEC’s website (www.sec.gov).
Contact
BankUnited, Inc.
Investor Relations:
James G. Mackey, 305-231-6793
Source: BankUnited, Inc.
6
BANKUNITED, INC. AND SUBSIDIARIES
CONSOLIDATED BALANCE SHEETS - UNAUDITED
(In thousands, except share and per share data)
| September 30, 2026 | June 30, 2026 | March 31, 2026 | December 31, 2025 | September 30, 2025 | |||||||||||||||||||||||||
| ASSETS | |||||||||||||||||||||||||||||
| Cash and due from banks: | |||||||||||||||||||||||||||||
| Non-interest bearing | $ | 12,082 | $ | 11,998 | $ | 13,336 | $ | 11,511 | $ | 13,589 | |||||||||||||||||||
| Interest bearing | 413,098 | 355,875 | 371,605 | 206,273 | 545,916 | ||||||||||||||||||||||||
| Cash and cash equivalents | 425,180 | 367,873 | 384,941 | 217,784 | 559,505 | ||||||||||||||||||||||||
| Investment securities | 8,905,357 | 9,317,614 | 9,505,168 | 9,263,651 | 9,467,082 | ||||||||||||||||||||||||
| Non-marketable equity securities | 158,666 | 144,652 | 149,590 | 140,684 | 165,922 | ||||||||||||||||||||||||
| Loans | 23,815,356 | 23,929,073 | 24,134,929 | 24,273,707 | 23,702,494 | ||||||||||||||||||||||||
| Allowance for credit losses | (221,476) | (217,516) | (208,790) | (219,825) | (219,884) | ||||||||||||||||||||||||
| Loans, net | 23,593,880 | 23,711,557 | 23,926,139 | 24,053,882 | 23,482,610 | ||||||||||||||||||||||||
| Bank owned life insurance | 323,020 | 315,848 | 314,165 | 305,313 | 303,368 | ||||||||||||||||||||||||
| Operating lease equipment, net | 151,701 | 157,272 | 150,214 | 171,371 | 201,777 | ||||||||||||||||||||||||
| Goodwill | 77,637 | 77,637 | 77,637 | 77,637 | 77,637 | ||||||||||||||||||||||||
| Other assets | 940,273 | 789,789 | 850,759 | 809,129 | 817,872 | ||||||||||||||||||||||||
| Total assets | $ | 34,575,714 | $ | 34,882,242 | $ | 35,358,613 | $ | 35,039,451 | $ | 35,075,773 | |||||||||||||||||||
| LIABILITIES AND STOCKHOLDERS’ EQUITY | |||||||||||||||||||||||||||||
| Liabilities: | |||||||||||||||||||||||||||||
| Demand deposits: | |||||||||||||||||||||||||||||
| Non-interest bearing | $ | 9,113,570 | $ | 9,934,638 | $ | 8,943,844 | $ | 9,109,984 | $ | 8,625,115 | |||||||||||||||||||
| Interest bearing | 6,255,347 | 6,619,044 | 6,449,405 | 6,189,534 | 6,609,679 | ||||||||||||||||||||||||
| Savings and money market | 9,899,164 | 9,958,785 | 9,939,985 | 10,164,703 | 9,936,797 | ||||||||||||||||||||||||
| Time | 3,042,882 | 2,368,781 | 4,026,866 | 3,888,684 | 3,446,696 | ||||||||||||||||||||||||
| Total deposits | 28,310,963 | 28,881,248 | 29,360,100 | 29,352,905 | 28,618,287 | ||||||||||||||||||||||||
| Federal funds purchased | 229,993 | 265,000 | — | — | — | ||||||||||||||||||||||||
| FHLB advances | 1,925,000 | 1,630,000 | 1,755,000 | 1,555,000 | 2,080,000 | ||||||||||||||||||||||||
| Notes and other borrowings | 318,532 | 318,936 | 319,340 | 319,740 | 320,431 | ||||||||||||||||||||||||
| Other liabilities | 969,006 | 783,653 | 908,636 | 757,977 | 1,024,681 | ||||||||||||||||||||||||
| Total liabilities | 31,753,494 | 31,878,837 | 32,343,076 | 31,985,622 | 32,043,399 | ||||||||||||||||||||||||
| Commitments and contingencies | |||||||||||||||||||||||||||||
| Stockholders' equity: | |||||||||||||||||||||||||||||
Common stock, par value $0.01 per share, 400,000,000 shares authorized | 702 | 722 | 734 | 741 | 752 | ||||||||||||||||||||||||
| Paid-in capital | 71,452 | 164,020 | 209,270 | 271,695 | 310,974 | ||||||||||||||||||||||||
| Retained earnings | 3,104,778 | 3,055,604 | 3,008,613 | 2,970,988 | 2,925,806 | ||||||||||||||||||||||||
| Accumulated other comprehensive loss | (354,712) | (216,941) | (203,080) | (189,595) | (205,158) | ||||||||||||||||||||||||
| Total stockholders' equity | 2,822,220 | 3,003,405 | 3,015,537 | 3,053,829 | 3,032,374 | ||||||||||||||||||||||||
| Total liabilities and stockholders' equity | $ | 34,575,714 | $ | 34,882,242 | $ | 35,358,613 | $ | 35,039,451 | $ | 35,075,773 | |||||||||||||||||||
7
BANKUNITED, INC. AND SUBSIDIARIES
CONSOLIDATED STATEMENTS OF INCOME - UNAUDITED
(In thousands, except per share data)
| Three Months Ended | |||||||||||||||||||||||||||||
| September 30, 2026 | June 30, 2026 | March 31, 2026 | December 31, 2025 | September 30, 2025 | |||||||||||||||||||||||||
| Interest income: | |||||||||||||||||||||||||||||
| Loans | $ | 314,391 | $ | 312,991 | $ | 310,162 | $ | 317,539 | $ | 324,390 | |||||||||||||||||||
| Investment securities | 110,066 | 107,603 | 106,230 | 117,878 | 120,419 | ||||||||||||||||||||||||
| Other | 5,570 | 5,916 | 5,794 | 6,986 | 8,113 | ||||||||||||||||||||||||
| Total interest income | 430,027 | 426,510 | 422,186 | 442,403 | 452,922 | ||||||||||||||||||||||||
| Interest expense: | |||||||||||||||||||||||||||||
| Deposits | 140,326 | 146,605 | 148,694 | 155,875 | 163,555 | ||||||||||||||||||||||||
| Borrowings | 29,047 | 24,577 | 24,505 | 28,318 | 39,255 | ||||||||||||||||||||||||
| Total interest expense | 169,373 | 171,182 | 173,199 | 184,193 | 202,810 | ||||||||||||||||||||||||
| Net interest income before provision for credit losses | 260,654 | 255,328 | 248,987 | 258,210 | 250,112 | ||||||||||||||||||||||||
| Provision for credit losses | 8,952 | 15,559 | 24,586 | 25,554 | 11,577 | ||||||||||||||||||||||||
| Net interest income after provision for credit losses | 251,702 | 239,769 | 224,401 | 232,656 | 238,535 | ||||||||||||||||||||||||
| Non-interest income: | |||||||||||||||||||||||||||||
| Deposit service charges and fees | 6,434 | 6,310 | 6,219 | 5,787 | 5,387 | ||||||||||||||||||||||||
| Gain (loss) on investment securities, net | (2,305) | 941 | 3,290 | 1,058 | 648 | ||||||||||||||||||||||||
| Lease financing, net | 1,715 | 3,885 | 3,347 | 4,662 | 4,152 | ||||||||||||||||||||||||
| Capital markets income | 6,261 | 8,081 | 3,684 | 9,512 | 6,269 | ||||||||||||||||||||||||
| Other non-interest income | 7,680 | 10,022 | 8,160 | 8,974 | 9,110 | ||||||||||||||||||||||||
| Total non-interest income | 19,785 | 29,239 | 24,700 | 29,993 | 25,566 | ||||||||||||||||||||||||
| Non-interest expense: | |||||||||||||||||||||||||||||
| Employee compensation and benefits | 89,648 | 89,432 | 96,689 | 89,952 | 85,196 | ||||||||||||||||||||||||
| Occupancy and equipment | 11,439 | 11,192 | 11,002 | 10,749 | 10,929 | ||||||||||||||||||||||||
| Deposit insurance expense | 5,535 | 5,334 | (1,026) | 6,391 | 6,601 | ||||||||||||||||||||||||
| Technology | 20,789 | 22,910 | 22,415 | 20,430 | 21,630 | ||||||||||||||||||||||||
| Depreciation of operating lease equipment | 3,396 | 3,169 | 3,366 | 4,068 | 4,423 | ||||||||||||||||||||||||
| Deposit-related costs | 23,595 | 21,492 | 18,210 | 18,765 | 19,197 | ||||||||||||||||||||||||
| Other non-interest expense | 20,156 | 21,119 | 16,707 | 22,456 | 18,193 | ||||||||||||||||||||||||
| Total non-interest expense | 174,558 | 174,648 | 167,363 | 172,811 | 166,169 | ||||||||||||||||||||||||
| Income before income taxes | 96,929 | 94,360 | 81,738 | 89,838 | 97,932 | ||||||||||||||||||||||||
| Provision for income taxes | 24,759 | 23,697 | 19,863 | 20,578 | 26,081 | ||||||||||||||||||||||||
| Net income | $ | 72,170 | $ | 70,663 | $ | 61,875 | $ | 69,260 | $ | 71,851 | |||||||||||||||||||
| Earnings per common share, basic | $ | 1.02 | $ | 0.97 | $ | 0.83 | $ | 0.91 | $ | 0.96 | |||||||||||||||||||
| Earnings per common share, diluted | $ | 1.01 | $ | 0.97 | $ | 0.83 | $ | 0.90 | $ | 0.95 | |||||||||||||||||||
8
BANKUNITED, INC. AND SUBSIDIARIES
CONSOLIDATED STATEMENTS OF INCOME - UNAUDITED
(In thousands, except per share data)
| Nine Months Ended | ||||||||||||||
| September 30, 2026 | September 30, 2025 | |||||||||||||
| Interest income: | ||||||||||||||
| Loans | $ | 937,544 | $ | 973,864 | ||||||||||
| Investment securities | 323,899 | 351,634 | ||||||||||||
| Other | 17,280 | 24,892 | ||||||||||||
| Total interest income | 1,278,723 | 1,350,390 | ||||||||||||
| Interest expense: | ||||||||||||||
| Deposits | 435,625 | 508,460 | ||||||||||||
| Borrowings | 78,129 | 112,560 | ||||||||||||
| Total interest expense | 513,754 | 621,020 | ||||||||||||
| Net interest income before provision for credit losses | 764,969 | 729,370 | ||||||||||||
| Provision for credit losses | 49,097 | 42,386 | ||||||||||||
| Net interest income after provision for credit losses | 715,872 | 686,984 | ||||||||||||
| Non-interest income: | ||||||||||||||
| Deposit service charges and fees | 18,963 | 15,945 | ||||||||||||
| Gain on investment securities, net | 1,926 | 1,940 | ||||||||||||
| Lease financing | 8,947 | 13,077 | ||||||||||||
| Capital markets income | 18,026 | 18,290 | ||||||||||||
| Other non-interest income | 25,862 | 26,394 | ||||||||||||
| Total non-interest income | 73,724 | 75,646 | ||||||||||||
| Non-interest expense: | ||||||||||||||
| Employee compensation and benefits | 275,769 | 251,095 | ||||||||||||
| Occupancy and equipment | 33,633 | 33,217 | ||||||||||||
| Deposit insurance expense | 9,843 | 20,804 | ||||||||||||
| Technology | 66,114 | 67,902 | ||||||||||||
| Depreciation of operating lease equipment | 9,931 | 12,301 | ||||||||||||
| Deposit-related costs | 63,297 | 52,740 | ||||||||||||
| Other non-interest expense | 57,982 | 52,663 | ||||||||||||
| Total non-interest expense | 516,569 | 490,722 | ||||||||||||
| Income before income taxes | 273,027 | 271,908 | ||||||||||||
| Provision for income taxes | 68,319 | 72,815 | ||||||||||||
| Net income | $ | 204,708 | $ | 199,093 | ||||||||||
| Earnings per common share, basic | $ | 2.82 | $ | 2.65 | ||||||||||
| Earnings per common share, diluted | $ | 2.80 | $ | 2.63 | ||||||||||
9
BANKUNITED, INC. AND SUBSIDIARIES
AVERAGE BALANCES AND YIELDS
(Dollars in thousands)
| Three Months Ended September 30, | Three Months Ended June 30, | Three Months Ended September 30, | |||||||||||||||||||||||||||||||||||||||||||||||||||
| 2026 | 2026 | 2025 | |||||||||||||||||||||||||||||||||||||||||||||||||||
| Average Balance | Interest 1 | Yield/ Rate 1,2 | Average Balance | Interest 1 | Yield/ Rate 1,2 | Average Balance | Interest 1 | Yield/ Rate 1,2 | |||||||||||||||||||||||||||||||||||||||||||||
| Assets: | |||||||||||||||||||||||||||||||||||||||||||||||||||||
| Interest earning assets: | |||||||||||||||||||||||||||||||||||||||||||||||||||||
| Commercial loans | $ | 16,922,172 | $ | 255,009 | 5.98 | % | $ | 17,084,880 | $ | 252,825 | 5.93 | % | 16,309,010 | 258,888 | 6.30 | % | |||||||||||||||||||||||||||||||||||||
| Residential and other consumer loans | 6,603,215 | 62,259 | 3.77 | % | 6,754,430 | 62,922 | 3.73 | % | 7,224,702 | 68,378 | 3.78 | % | |||||||||||||||||||||||||||||||||||||||||
| Total Loans | $ | 23,525,387 | $ | 317,268 | 5.36 | % | $ | 23,839,310 | $ | 315,747 | 5.31 | % | $ | 23,533,712 | $ | 327,266 | 5.53 | % | |||||||||||||||||||||||||||||||||||
Investment securities3 | 9,313,577 | 111,227 | 4.76 | % | 9,381,602 | 108,693 | 4.64 | % | 9,404,188 | 121,124 | 5.13 | % | |||||||||||||||||||||||||||||||||||||||||
| Other interest earning assets | 542,000 | 5,570 | 4.08 | % | 682,205 | 5,916 | 3.48 | % | 793,366 | 8,113 | 4.06 | % | |||||||||||||||||||||||||||||||||||||||||
| Total interest earning assets | 33,380,964 | 434,065 | 5.17 | % | 33,903,117 | 430,356 | 5.09 | % | 33,731,266 | 456,503 | 5.38 | % | |||||||||||||||||||||||||||||||||||||||||
| Allowance for credit losses | (220,307) | (213,533) | (227,694) | ||||||||||||||||||||||||||||||||||||||||||||||||||
| Non-interest earning assets | 1,557,166 | 1,356,431 | 1,390,051 | ||||||||||||||||||||||||||||||||||||||||||||||||||
| Total assets | $ | 34,717,823 | $ | 35,046,015 | $ | 34,893,623 | |||||||||||||||||||||||||||||||||||||||||||||||
| Liabilities and Stockholders' Equity: | |||||||||||||||||||||||||||||||||||||||||||||||||||||
| Interest bearing liabilities: | |||||||||||||||||||||||||||||||||||||||||||||||||||||
| Interest bearing demand deposits | $ | 6,620,530 | $ | 47,165 | 2.83 | % | $ | 6,365,179 | $ | 45,432 | 2.87 | % | $ | 5,586,547 | $ | 47,304 | 3.36 | % | |||||||||||||||||||||||||||||||||||
| Savings and money market deposits | 9,976,749 | 73,071 | 2.90 | % | 10,083,767 | 72,729 | 2.89 | % | 9,921,293 | 83,862 | 3.35 | % | |||||||||||||||||||||||||||||||||||||||||
| Time deposits | 2,339,315 | 20,090 | 3.40 | % | 3,251,965 | 28,444 | 3.51 | % | 3,535,051 | 32,389 | 3.63 | % | |||||||||||||||||||||||||||||||||||||||||
| Total interest bearing deposits | 18,936,594 | 140,326 | 2.94 | % | 19,700,911 | 146,605 | 2.99 | % | 19,042,891 | 163,555 | 3.40 | % | |||||||||||||||||||||||||||||||||||||||||
| FHLB advances | 2,276,250 | 21,972 | 3.83 | % | 2,028,901 | 18,991 | 3.75 | % | 3,221,577 | 32,027 | 3.94 | % | |||||||||||||||||||||||||||||||||||||||||
| Notes and other borrowings | 625,179 | 7,075 | 4.51 | % | 471,725 | 5,586 | 4.74 | % | 542,241 | 7,228 | 5.34 | % | |||||||||||||||||||||||||||||||||||||||||
| Total interest bearing liabilities | 21,838,023 | 169,373 | 3.08 | % | 22,201,537 | 171,182 | 3.10 | % | 22,806,709 | 202,810 | 3.52 | % | |||||||||||||||||||||||||||||||||||||||||
| Non-interest bearing demand deposits | 9,027,447 | 9,027,557 | 8,203,439 | ||||||||||||||||||||||||||||||||||||||||||||||||||
| Other non-interest bearing liabilities | 859,525 | 776,682 | 868,385 | ||||||||||||||||||||||||||||||||||||||||||||||||||
| Total liabilities | 31,724,995 | 32,005,776 | 31,878,533 | ||||||||||||||||||||||||||||||||||||||||||||||||||
| Stockholders' equity | 2,992,828 | 3,040,239 | 3,015,090 | ||||||||||||||||||||||||||||||||||||||||||||||||||
| Total liabilities and stockholders' equity | $ | 34,717,823 | $ | 35,046,015 | $ | 34,893,623 | |||||||||||||||||||||||||||||||||||||||||||||||
| Net interest income | $ | 264,692 | $ | 259,174 | $ | 253,693 | |||||||||||||||||||||||||||||||||||||||||||||||
| Interest rate spread | 2.09 | % | 1.99 | % | 1.86 | % | |||||||||||||||||||||||||||||||||||||||||||||||
| Net interest margin | 3.16 | % | 3.06 | % | 3.00 | % | |||||||||||||||||||||||||||||||||||||||||||||||
(1) On a tax-equivalent basis where applicable.
(2) Annualized.
(3) At fair value.
10
BANKUNITED, INC. AND SUBSIDIARIES
AVERAGE BALANCES AND YIELDS
(Dollars in thousands)
| Nine Months Ended September 30, | |||||||||||||||||||||||||||||||||||
| 2026 | 2025 | ||||||||||||||||||||||||||||||||||
| Average Balance | Interest1 | Yield/ Rate 1,2 | Average Balance | Interest 1 | Yield/ Rate 1,2 | ||||||||||||||||||||||||||||||
| Assets: | |||||||||||||||||||||||||||||||||||
| Interest earning assets: | |||||||||||||||||||||||||||||||||||
| Commercial loans | $ | 16,971,269 | $ | 756,712 | 5.96 | % | $ | 16,412,801 | $ | 773,024 | 6.30 | % | |||||||||||||||||||||||
| Residential and other consumer loans | 6,760,966 | 189,114 | 3.73 | % | 7,375,357 | 209,160 | 3.78 | % | |||||||||||||||||||||||||||
| Total Loans | $ | 23,732,235 | $ | 945,826 | 5.32 | % | $ | 23,788,158 | $ | 982,184 | 5.52 | % | |||||||||||||||||||||||
| Investment securities3 | 9,283,724 | 326,850 | 4.70 | % | 9,288,070 | 353,760 | 5.08 | % | |||||||||||||||||||||||||||
| Other interest earning assets | 631,787 | 17,280 | 3.66 | % | 798,956 | 24,892 | 4.17 | % | |||||||||||||||||||||||||||
| Total interest earning assets | 33,647,746 | 1,289,956 | 5.12 | % | 33,875,184 | 1,360,836 | 5.37 | % | |||||||||||||||||||||||||||
| Allowance for credit losses | (217,555) | (227,680) | |||||||||||||||||||||||||||||||||
| Non-interest earning assets | 1,519,357 | 1,376,969 | |||||||||||||||||||||||||||||||||
| Total assets | $ | 34,949,548 | $ | 35,024,473 | |||||||||||||||||||||||||||||||
| Liabilities and Stockholders' Equity: | |||||||||||||||||||||||||||||||||||
| Interest bearing liabilities: | |||||||||||||||||||||||||||||||||||
| Interest bearing demand deposits | $ | 6,341,755 | $ | 135,892 | 2.87 | % | $ | 5,271,474 | $ | 132,886 | 3.37 | % | |||||||||||||||||||||||
| Savings and money market deposits | 10,101,084 | 219,078 | 2.90 | % | 10,366,899 | 263,664 | 3.40 | % | |||||||||||||||||||||||||||
| Time deposits | 3,109,007 | 80,655 | 3.47 | % | 3,924,209 | 111,910 | 3.82 | % | |||||||||||||||||||||||||||
| Total interest bearing deposits | 19,551,846 | 435,625 | 2.98 | % | 19,562,582 | 508,460 | 3.48 | % | |||||||||||||||||||||||||||
| FHLB advances | 2,166,667 | 60,860 | 3.76 | % | 3,052,253 | 87,060 | 3.81 | % | |||||||||||||||||||||||||||
| Notes and other borrowings | 488,745 | 17,269 | 4.72 | % | 652,843 | 25,500 | 5.21 | % | |||||||||||||||||||||||||||
| Total interest bearing liabilities | 22,207,258 | 513,754 | 3.09 | % | 23,267,678 | 621,020 | 3.57 | % | |||||||||||||||||||||||||||
| Non-interest bearing demand deposits | 8,841,564 | 7,873,052 | |||||||||||||||||||||||||||||||||
| Other non-interest bearing liabilities | 855,402 | 934,559 | |||||||||||||||||||||||||||||||||
| Total liabilities | 31,904,224 | 32,075,289 | |||||||||||||||||||||||||||||||||
| Stockholders' equity | 3,045,324 | 2,949,184 | |||||||||||||||||||||||||||||||||
| Total liabilities and stockholders' equity | $ | 34,949,548 | $ | 35,024,473 | |||||||||||||||||||||||||||||||
| Net interest income | $ | 776,202 | $ | 739,816 | |||||||||||||||||||||||||||||||
| Interest rate spread | 2.03 | % | 1.80 | % | |||||||||||||||||||||||||||||||
| Net interest margin | 3.08 | % | 2.92 | % | |||||||||||||||||||||||||||||||
(1) On a tax-equivalent basis where applicable.
(2) Annualized.
(3) At fair value.
11
BANKUNITED, INC. AND SUBSIDIARIES
EARNINGS PER COMMON SHARE
(In thousands except share and per share amounts)
| Three Months Ended | Nine Months Ended | ||||||||||||||||||||||||||||
| September 30, 2026 | June 30, 2026 | September 30, 2025 | September 30, 2026 | September 30, 2025 | |||||||||||||||||||||||||
| Basic earnings per common share: | |||||||||||||||||||||||||||||
| Numerator: | |||||||||||||||||||||||||||||
Net income | $ | 72,170 | $ | 70,663 | $ | 71,851 | $ | 204,708 | $ | 199,093 | |||||||||||||||||||
Distributed and undistributed earnings allocated to participating securities | (1,140) | (1,094) | (1,030) | (3,137) | (2,829) | ||||||||||||||||||||||||
| Income allocated to common stockholders for basic earnings per common share | $ | 71,030 | $ | 69,569 | $ | 70,821 | $ | 201,571 | $ | 196,264 | |||||||||||||||||||
| Denominator: | |||||||||||||||||||||||||||||
| Weighted average common shares outstanding | 71,132,255 | 72,630,405 | 75,227,314 | 72,748,103 | 75,124,070 | ||||||||||||||||||||||||
| Less average unvested stock awards | (1,164,631) | (1,180,777) | (1,116,965) | (1,161,394) | (1,114,472) | ||||||||||||||||||||||||
| Weighted average shares for basic earnings per common share | 69,967,624 | 71,449,628 | 74,110,349 | 71,586,709 | 74,009,598 | ||||||||||||||||||||||||
| Basic earnings per common share | $ | 1.02 | $ | 0.97 | $ | 0.96 | $ | 2.82 | $ | 2.65 | |||||||||||||||||||
| Diluted earnings per common share: | |||||||||||||||||||||||||||||
| Numerator: | |||||||||||||||||||||||||||||
| Income allocated to common stockholders for basic earnings per common share | $ | 71,030 | $ | 69,569 | $ | 70,821 | $ | 201,571 | $ | 196,264 | |||||||||||||||||||
Adjustment for earnings reallocated from participating securities | 6 | 4 | 7 | 14 | 15 | ||||||||||||||||||||||||
| Income used in calculating diluted earnings per common share | $ | 71,036 | $ | 69,573 | $ | 70,828 | $ | 201,585 | $ | 196,279 | |||||||||||||||||||
| Denominator: | |||||||||||||||||||||||||||||
| Weighted average shares for basic earnings per common share | 69,967,624 | 71,449,628 | 74,110,349 | 71,586,709 | 74,009,598 | ||||||||||||||||||||||||
| Dilutive effect of certain share-based awards | 573,006 | 342,179 | 715,117 | 475,845 | 601,031 | ||||||||||||||||||||||||
Weighted average shares for diluted earnings per common share | 70,540,630 | 71,791,807 | 74,825,466 | 72,062,554 | 74,610,629 | ||||||||||||||||||||||||
| Diluted earnings per common share | $ | 1.01 | $ | 0.97 | $ | 0.95 | $ | 2.80 | $ | 2.63 | |||||||||||||||||||
12
BANKUNITED, INC. AND SUBSIDIARIES
SELECTED RATIOS
| At or for the Three Months Ended | At or for the Years Ended | ||||||||||||||||||||||||||||
| September 30, 2026 | June 30, 2026 | September 30, 2025 | September 30, 2026 | September 30, 2025 | |||||||||||||||||||||||||
Financial ratios 1 | |||||||||||||||||||||||||||||
| Return on average assets | 0.82 | % | 0.81 | % | 0.82 | % | 0.78 | % | 0.76 | % | |||||||||||||||||||
| Return on average stockholders’ equity | 9.6 | % | 9.3 | % | 9.5 | % | 9.0 | % | 9.0 | % | |||||||||||||||||||
Net interest margin 2 | 3.16 | % | 3.06 | % | 3.00 | % | 3.08 | % | 2.92 | % | |||||||||||||||||||
| Loans to deposits | 84.1 | % | 82.9 | % | 82.8 | % | 84.1 | % | 82.8 | % | |||||||||||||||||||
| Tangible book value per common share | $ | 39.10 | $ | 40.48 | $ | 39.27 | $ | 39.10 | $ | 39.27 | |||||||||||||||||||
| September 30, 2026 | June 30, 2026 | September 30, 2025 | |||||||||||||||
| Asset quality ratios | |||||||||||||||||
Non-performing loans to total loans 3,4 | 1.11 | % | 0.94 | % | 1.60 | % | |||||||||||
Non-performing assets to total assets 4,5 | 0.77 | % | 0.66 | % | 1.10 | % | |||||||||||
| ACL to total loans | 0.93 | % | 0.91 | % | 0.93 | % | |||||||||||
Commercial ACL to commercial loans 6 | 1.33 | % | 1.30 | % | 1.35 | % | |||||||||||
ACL to non-performing loans 3,4 | 83.96 | % | 97.14 | % | 57.95 | % | |||||||||||
Net charge-offs to average loans 7 | 0.11 | % | 0.11 | % | 0.25 | % | |||||||||||
| September 30, 2026 | June 30, 2026 | September 30, 2025 | Required to be Considered Well Capitalized | ||||||||||||||||||||||||||||||||||||||
| BankUnited, Inc. | BankUnited, N.A. | BankUnited, Inc. | BankUnited, N.A. | BankUnited, Inc. | BankUnited, N.A. | ||||||||||||||||||||||||||||||||||||
| Capital ratios | |||||||||||||||||||||||||||||||||||||||||
| Tier 1 leverage | 8.9 | % | 9.5 | % | 8.9 | % | 9.4 | % | 9.0 | % | 9.5 | % | 5.0 | % | |||||||||||||||||||||||||||
| Common Equity Tier 1 ("CET1") risk-based capital | 12.1 | % | 12.9 | % | 12.3 | % | 13.0 | % | 12.5 | % | 13.2 | % | 6.5 | % | |||||||||||||||||||||||||||
| Total risk-based capital | 13.7 | % | 13.8 | % | 13.9 | % | 13.9 | % | 14.4 | % | 14.1 | % | 10.0 | % | |||||||||||||||||||||||||||
| Tangible Common Equity/Tangible Assets | 8.0 | % | N/A | 8.4 | % | N/A | 8.4 | % | N/A | N/A | |||||||||||||||||||||||||||||||
(1) Annualized for the three month periods as applicable.
(2) On a tax-equivalent basis.
(3) We define non-performing loans to include non-accrual loans and loans other than purchased credit deteriorated and government insured residential loans that are past due 90 days or more and still accruing. Contractually delinquent purchased credit deteriorated and government insured residential loans on which interest continues to be accrued are excluded from non-performing loans.
(4) Non-performing loans and assets include the guaranteed portion of non-accrual SBA loans totaling $31.5 million or 0.13% of total loans and 0.09% of total assets at September 30, 2026, $31.8 million or 0.13% of total loans and 0.09% of total assets at June 30, 2026, and $40.0 million or 0.17% of total loans and 0.11% of total assets at September 30, 2025.
(5) Non-performing assets include non-performing loans, OREO and other repossessed assets.
(6) For purposes of this ratio, commercial loans includes the C&I and CRE sub-segments, as well as franchise and equipment finance. Due to their unique risk profiles, MWL and municipal finance are excluded from this ratio.
(7) Annualized for the three months ended September 30, 2026, June 30, 2026, and September 30, 2025.
13
Non-GAAP Financial Measures
Net income, EPS, ROA and ROE excluding the impact of gains and losses on the sale of investment securities are non-GAAP financial measures. Disclosure of these measures enhances the reader’s ability to compare the Company’s performance for the quarter ending September 30, 2026 to other periods presented.
The following table reconciles these non-GAAP financial measurements to the comparable GAAP financial measurements of net income, EPS, ROA and ROE for the quarter ending September 30, 2026 to the periods presented (in thousands except share and per share data):
| Quarter Ended | |||||||||||||||||
| September 30, 2026 | June 30, 2026 | September 30, 2025 | |||||||||||||||
| Net income (GAAP) | $ | 72,170 | $ | 70,663 | $ | 71,851 | |||||||||||
| (Gain)/Loss on investment securities - tax effected | 1,716 | (704) | (476) | ||||||||||||||
| Adjusted net income | $ | 73,886 | $ | 69,959 | $ | 71,375 | |||||||||||
| Pre-tax income | $ | 96,929 | $ | 94,360 | $ | 97,932 | |||||||||||
| Provision for credit losses | 8,952 | 15,559 | 11,577 | ||||||||||||||
| PPNR | $ | 105,881 | $ | 109,919 | $ | 109,509 | |||||||||||
| (Gain)/Loss on investment securities - before tax | 2,305 | (941) | (648) | ||||||||||||||
| Adjusted PPNR | $ | 108,186 | $ | 108,978 | $ | 108,861 | |||||||||||
| Average assets | $ | 34,717,823 | $ | 35,046,015 | $ | 34,893,623 | |||||||||||
| ROA (GAAP) | 0.82 | % | 0.81 | % | 0.82 | % | |||||||||||
| Adjusted ROA | 0.84 | % | 0.80 | % | 0.81 | % | |||||||||||
| Average stockholders’ equity | $ | 2,992,828 | $ | 3,040,239 | $ | 3,015,090 | |||||||||||
| ROE (GAAP) | 9.6 | % | 9.3 | % | 9.5 | % | |||||||||||
| Adjusted ROE | 9.8 | % | 9.2 | % | 9.4 | % | |||||||||||
| EPS (GAAP) | $ | 1.01 | $ | 0.97 | $ | 0.95 | |||||||||||
| (Gain)/Loss on investment securities - tax effected | 0.02 | (0.01) | (0.01) | ||||||||||||||
| Adjusted EPS | $ | 1.03 | $ | 0.96 | $ | 0.94 | |||||||||||
14
Tangible book value per common share is a non-GAAP financial measure. Management believes this measure is relevant to understanding the capital position and performance of the Company. Disclosure of this non-GAAP financial measure also provides a meaningful basis for comparison to other financial institutions as it is a metric commonly used in the banking industry.
PPNR is a non-GAAP financial measure. Management believes this measure is relevant to understanding the performance of the Company attributable to elements other than the provision for credit losses and the ability of the Company to generate earnings sufficient to cover estimated credit losses. This measure also provides a meaningful basis for comparison to other financial institutions since it is commonly employed and is a measure frequently cited by investors and analysts.
The following tables reconcile these non-GAAP financial measurements to the comparable GAAP financial measurements at the dates and for the periods indicated (in thousands except share and per share data):
| September 30, 2026 | June 30, 2026 | September 30, 2025 | |||||||||||||||
| Total stockholders’ equity | $ | 2,822,220 | $ | 3,003,405 | $ | 3,032,374 | |||||||||||
| Less: goodwill and other intangible assets | 77,637 | 77,637 | 77,637 | ||||||||||||||
| Tangible stockholders’ equity | $ | 2,744,583 | $ | 2,925,768 | $ | 2,954,737 | |||||||||||
| Common shares issued and outstanding | 70,188,199 | 72,276,530 | 75,242,935 | ||||||||||||||
| Book value per common share | $ | 40.21 | $ | 41.55 | $ | 40.30 | |||||||||||
| Tangible book value per common share | $ | 39.10 | $ | 40.48 | $ | 39.27 | |||||||||||
Quarter Ended | |||||||||||||||||
| September 30, 2026 | June 30, 2026 | September 30, 2025 | |||||||||||||||
| Pre-Provision Net Revenue ("PPNR") | |||||||||||||||||
| Income before income taxes | $ | 96,929 | $ | 94,360 | $ | 97,932 | |||||||||||
| Provision for credit losses | 8,952 | 15,559 | 11,577 | ||||||||||||||
| PPNR | $ | 105,881 | $ | 109,919 | $ | 109,509 | |||||||||||
15
Earnings & Financial Performance Exhibit 99.2 Q3 2026 Financial Results October 21, 2026
Forward-Looking Statements 2 This presentation contains forward-looking statements within the meaning of the Private Securities Litigation Reform Act of 1995 that reflect the current views of BankUnited, Inc. (“BankUnited”, “BKU”, or the “Company”) with respect to, among other things, future events and financial performance, dividend payments and stock repurchases. The Company generally identifies forward-looking statements by terminology such as “outlook,” “believes,” “expects,” “potential,” “continues,” “may,” “will,” “could,” “should,” “seeks,” “approximately,” “predicts,” “intends,” “plans,” “estimates,” “anticipates,” "forecasts" or the negative version of those words or other comparable words. Any forward-looking statements contained in this presentation are based on the historical performance of the Company and its subsidiaries or on the Company’s current plans, estimates and expectations. The inclusion of this forward-looking information should not be regarded as a representation by the Company that the future plans, estimates or expectations contemplated by the Company will be achieved. Such forward-looking statements are subject to various risks and uncertainties and assumptions, including (without limitation) those relating to the Company’s operations, financial results, financial condition, business prospects, growth strategy and liquidity, including as impacted by external circumstances outside the Company's direct control, such as (1) an inability to successfully execute our core business strategy; (2) adverse events or conditions impacting the financial services industry, (3) our ability to access capital, including the impact of our credit rating; (4) credit risk inherent in the business of making loans and embedded in our securities portfolio, including inadequate allowance for credit losses and real estate market conditions and valuations; (5) interest rate risk, (6) liquidity risks, (7) risks related to the regulation of our industry, (8) operational risk, including dependence on information technology and third party service providers and the risk of systems failures, interruptions or breaches of security or inability to keep pace with technological change; (9) reputational risk, (10) the impact of conditions in the financial markets and economic conditions generally; (11) ineffective risk management or internal controls; and (12) the selection and application of accounting policies and methods and related assumptions and estimates. If one or more of these or other risks or uncertainties materialize, or if the Company’s underlying assumptions prove to be incorrect, the Company’s actual results may vary materially from those indicated in these statements. These factors should not be construed as exhaustive. The Company does not undertake any obligation to publicly update or review any forward-looking statement, whether as a result of new information, future developments or otherwise. A number of important factors could cause actual results to differ materially from those indicated by the forward-looking statements. Information on these factors can be found in the Company’s Annual Report on Form 10-K for the year ended December 31, 2025 and any subsequent Quarterly Report on Form 10-Q or Current Report on Form 8-K, which are available at the SEC’s website (www.sec.gov).
Executing On and Delivering Shareholder Value 3 • $1.01 diluted EPS, up $0.06 vs a year ago • $1.03 adjusted diluted EPS(1) up $0.09 from a year ago • Net interest income of $260.7 million; NIM of 3.16%, up 16 bps vs a year ago • Provision for credit losses of $9.0 million, down $2.6 million, or 23%, vs a year ago • Criticized and classified loans down $176 million, or 14%, vs year ago • NPLs down $116 million, or 30%, vs a year ago • Net charge-offs ratio(2) of 0.11%, down from 0.25% vs a year ago • Ending non-interest demand deposits (NIDDA) represented 32% of total deposits; up $488 million, or 6%, vs a year ago • Average NIDDA up $824 million, or 10%, vs a year ago • Average total deposits (excluding brokered) up $1.0 billion vs a year ago • Average core loans(3) increased $706 million, or 4%, vs a year ago Financial Performance Funding and Asset Mix (1) Excludes the impact of securities sales. See Non-GAAP reconciliation at page 21. (2) Annualized for the three months ended September 30, 2026 and three months ended September 30, 2025. (3) Core Loans include CRE, C&I, Mortgage Warehouse Lending, and Municipal Finance. (4) Returned $44.5 million during the year ended December 31, 2025. Capital • CET1 ratio of 12.1% • Returned $97.0 million during the quarter and $206.7 million during the nine months ended September 30, 2026 to shareholders through share repurchases(4)
Key Profitability Metrics Are Steadily Improving ($ in millions) 4 $72 $69 $62 $71 $72$71 $71 $59 $70 $74Net Income Adj. Net Income 3Q25 4Q25 1Q26 2Q26 3Q26 9.5% 8.9% 8.1% 9.3% 9.6%9.4% 9.1% 7.8% 9.2% 9.8% ROE Adj. ROE 3Q25 4Q25 1Q26 2Q26 3Q26 $250 $258 $249 $255 $261 3.00% 3.06% 2.99% 3.06% 3.16% Net Interest Income NIM 3Q25 4Q25 1Q26 2Q26 3Q26 0.82% 0.78% 0.72% 0.81% 0.82%0.81% 0.80% 0.69% 0.80% 0.84% ROA Adj. ROA 3Q25 4Q25 1Q26 2Q26 3Q26 Net Interest Income & Net Interest Margin Net Income Return on Assets(3) Return on Equity(3) $110 $115 $106 $110 $106$109 $118 $103 $109 $108 PPNR Adj. PPNR 3Q25 4Q25 1Q26 2Q26 3Q26 Pre-Provision Net Revenue(1) $0.95 $0.90 $0.83 $0.97 $1.01$0.94 $0.93 $0.79 $0.96 $1.03 EPS Adj. EPS 3Q25 4Q25 1Q26 2Q26 3Q26 EPS (1) Represents a non-GAAP measure. See appendix for a reconciliation of non-GAAP financial measures to GAAP financial measures. (2) Excludes the impact of securities sales. (3) Q42025 is adjusted for the impact of write downs of previously capitalized software totaling $3.8 million before taxes. (4) Quarterly annualized ratios. (1)(2)(3) (1)(2)(3) (1)(2)(3) (1)(2)(3) (4) (1)(2)(3)
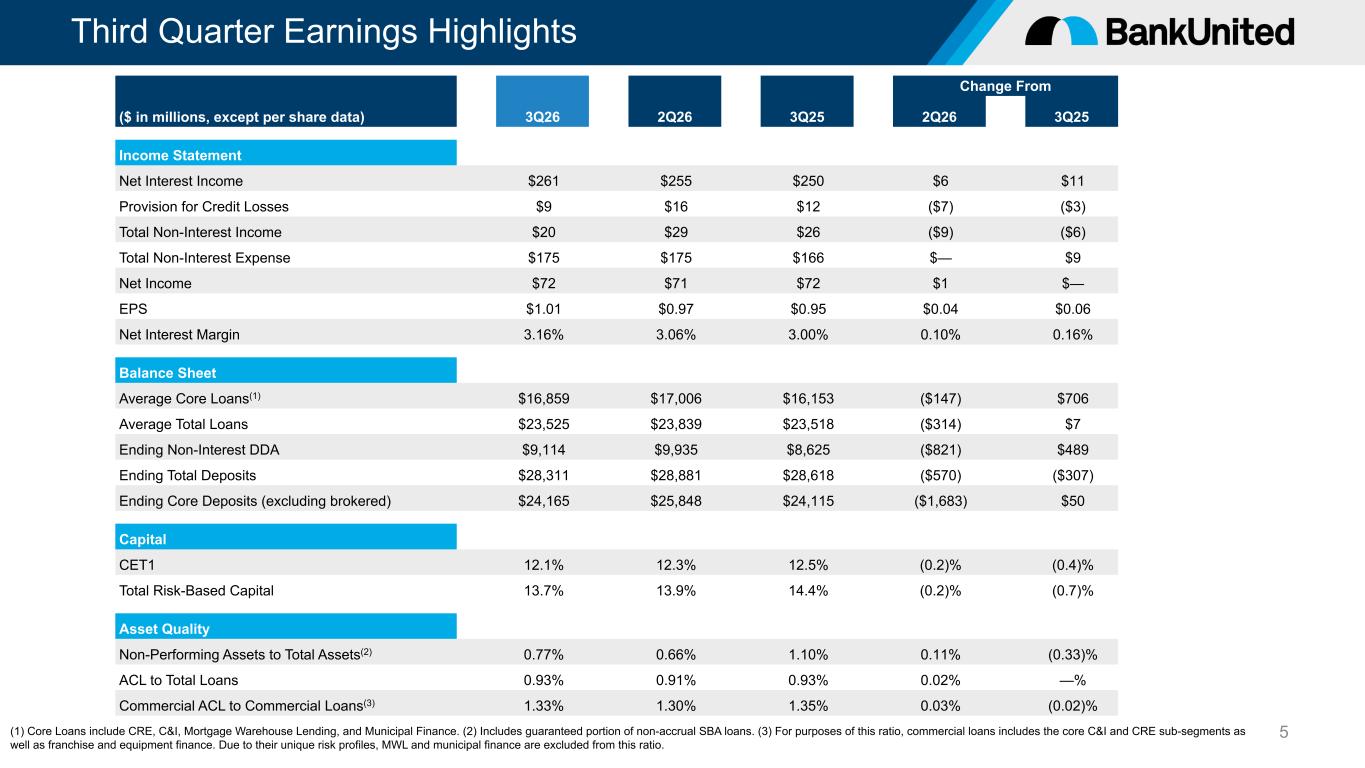
Third Quarter Earnings Highlights 5 Change From ($ in millions, except per share data) 3Q26 2Q26 3Q25 2Q26 3Q25 Income Statement Net Interest Income $261 $255 $250 $6 $11 Provision for Credit Losses $9 $16 $12 ($7) ($3) Total Non-Interest Income $20 $29 $26 ($9) ($6) Total Non-Interest Expense $175 $175 $166 $— $9 Net Income $72 $71 $72 $1 $— EPS $1.01 $0.97 $0.95 $0.04 $0.06 Net Interest Margin 3.16% 3.06% 3.00% 0.10% 0.16% Balance Sheet Average Core Loans(1) $16,859 $17,006 $16,153 ($147) $706 Average Total Loans $23,525 $23,839 $23,518 ($314) $7 Ending Non-Interest DDA $9,114 $9,935 $8,625 ($821) $489 Ending Total Deposits $28,311 $28,881 $28,618 ($570) ($307) Ending Core Deposits (excluding brokered) $24,165 $25,848 $24,115 ($1,683) $50 Capital CET1 12.1% 12.3% 12.5% (0.2)% (0.4)% Total Risk-Based Capital 13.7% 13.9% 14.4% (0.2)% (0.7)% Asset Quality Non-Performing Assets to Total Assets(2) 0.77% 0.66% 1.10% 0.11% (0.33)% ACL to Total Loans 0.93% 0.91% 0.93% 0.02% —% Commercial ACL to Commercial Loans(3) 1.33% 1.30% 1.35% 0.03% (0.02)% (1) Core Loans include CRE, C&I, Mortgage Warehouse Lending, and Municipal Finance. (2) Includes guaranteed portion of non-accrual SBA loans. (3) For purposes of this ratio, commercial loans includes the core C&I and CRE sub-segments as well as franchise and equipment finance. Due to their unique risk profiles, MWL and municipal finance are excluded from this ratio.
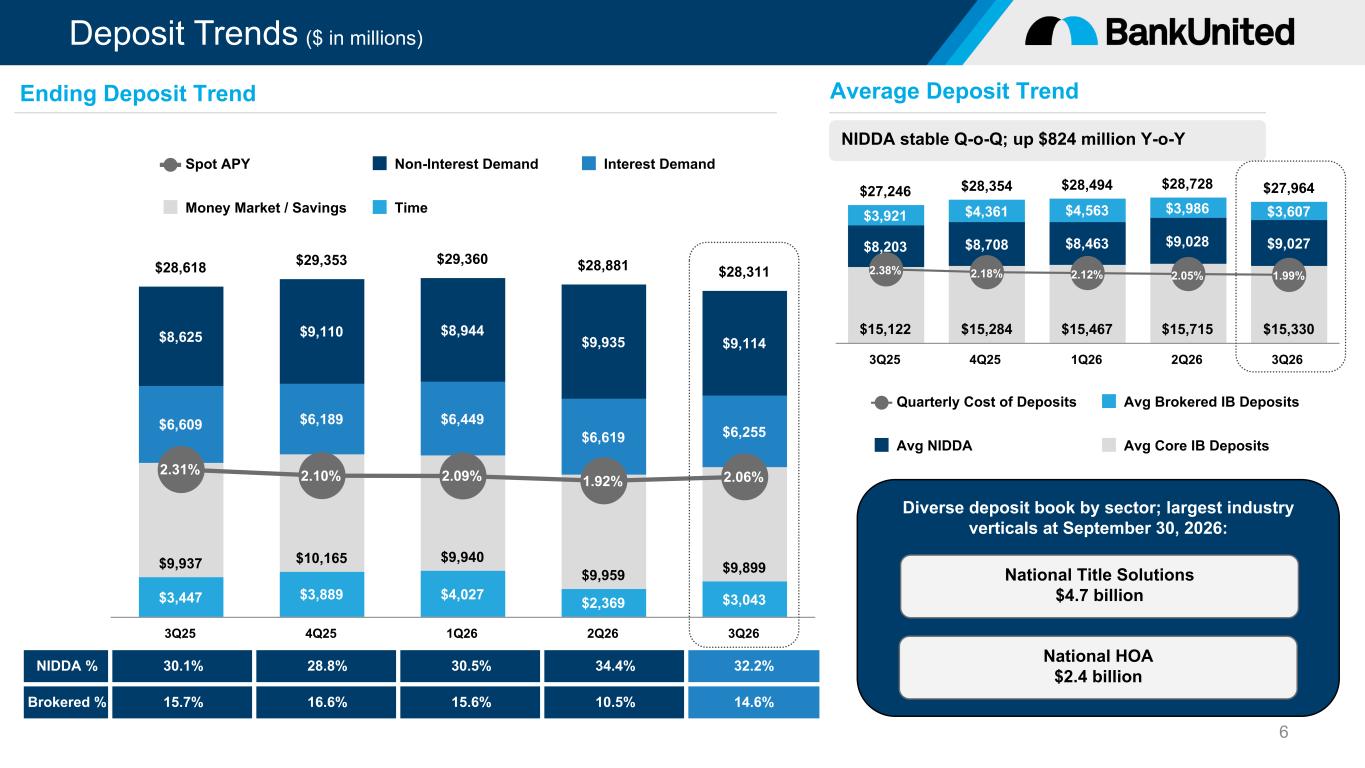
Deposit Trends ($ in millions) $3,447 $3,889 $4,027 $2,369 $3,043 $9,937 $10,165 $9,940 $9,959 $9,899 $6,609 $6,189 $6,449 $6,619 $6,255 $8,625 $9,110 $8,944 $9,935 $9,114 $28,618 $29,353 $29,360 $28,881 $28,311 2.31% 2.10% 2.09% 1.92% 2.06% Spot APY Non-Interest Demand Interest Demand Money Market / Savings Time 3Q25 4Q25 1Q26 2Q26 3Q26 6 NIDDA % 30.1% 28.8% 30.5% 34.4% 32.2% Brokered % 15.7% 16.6% 15.6% 10.5% 14.6% Diverse deposit book by sector; largest industry verticals at September 30, 2026: Ending Deposit Trend Average Deposit Trend NIDDA stable Q-o-Q; up $824 million Y-o-Y $27,246 $28,354 $28,494 $28,728 $27,964 $15,122 $15,284 $15,467 $15,715 $15,330 $8,203 $8,708 $8,463 $9,028 $9,027 $3,921 $4,361 $4,563 $3,986 $3,607 2.38% 2.18% 2.12% 2.05% 1.99% Quarterly Cost of Deposits Avg Brokered IB Deposits Avg NIDDA Avg Core IB Deposits 3Q25 4Q25 1Q26 2Q26 3Q26 National Title Solutions $4.7 billion National HOA $2.4 billion
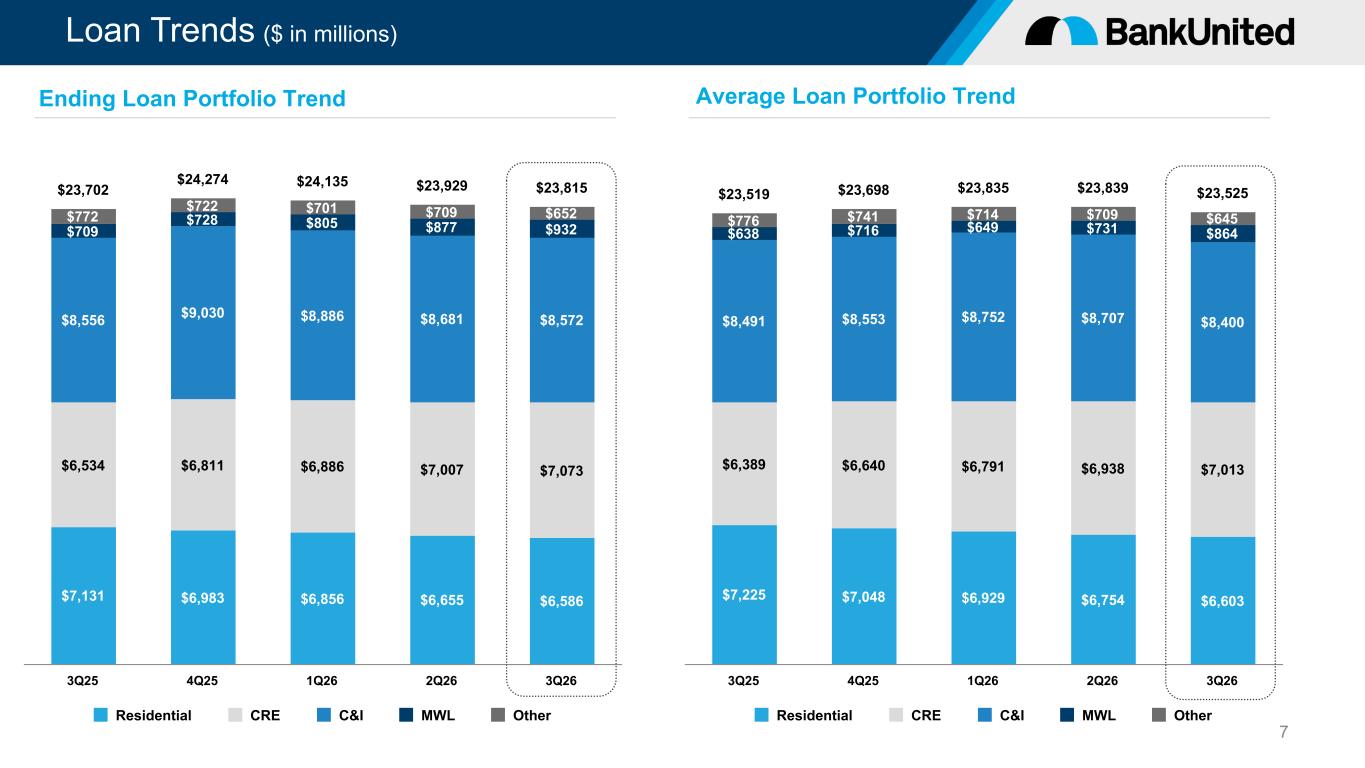
Loan Trends ($ in millions) $7,131 $6,983 $6,856 $6,655 $6,586 $6,534 $6,811 $6,886 $7,007 $7,073 $8,556 $9,030 $8,886 $8,681 $8,572 $709 $728 $805 $877 $932 $772 $722 $701 $709 $652 $23,702 $24,274 $24,135 $23,929 $23,815 Residential CRE C&I MWL Other 3Q25 4Q25 1Q26 2Q26 3Q26 7 Ending Loan Portfolio Trend Average Loan Portfolio Trend $7,225 $7,048 $6,929 $6,754 $6,603 $6,389 $6,640 $6,791 $6,938 $7,013 $8,491 $8,553 $8,752 $8,707 $8,400 $638 $716 $649 $731 $864 $776 $741 $714 $709 $645 $23,519 $23,698 $23,835 $23,839 $23,525 Residential CRE C&I MWL Other 3Q25 4Q25 1Q26 2Q26 3Q26
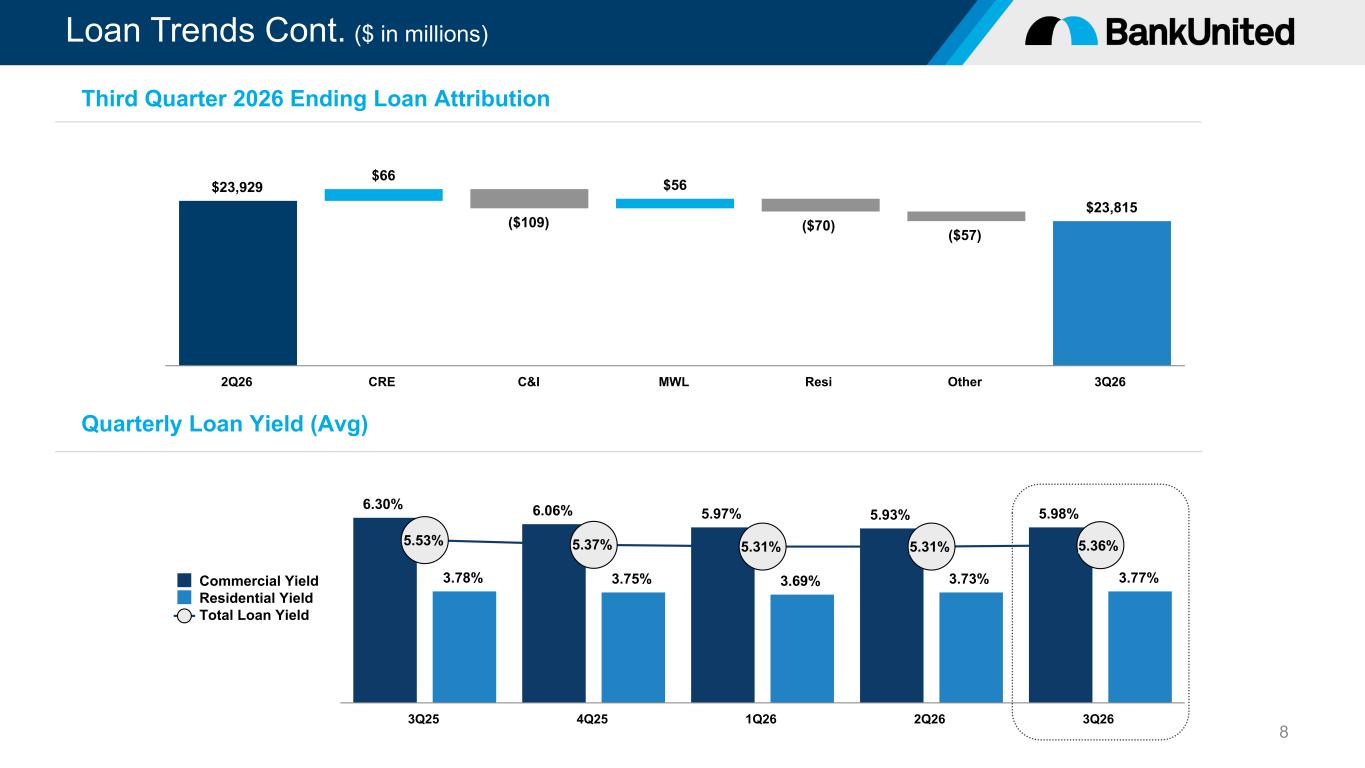
Loan Trends Cont. ($ in millions) 8 $23,929 $66 ($109) $56 ($70) ($57) $23,815 2Q26 CRE C&I MWL Resi Other 3Q26 Third Quarter 2026 Ending Loan Attribution 6.30% 6.06% 5.97% 5.93% 5.98% 3.78% 3.75% 3.69% 3.73% 3.77% 5.53% 5.37% 5.31% 5.31% 5.36% Commercial Yield Residential Yield Total Loan Yield 3Q25 4Q25 1Q26 2Q26 3Q26 Quarterly Loan Yield (Avg)
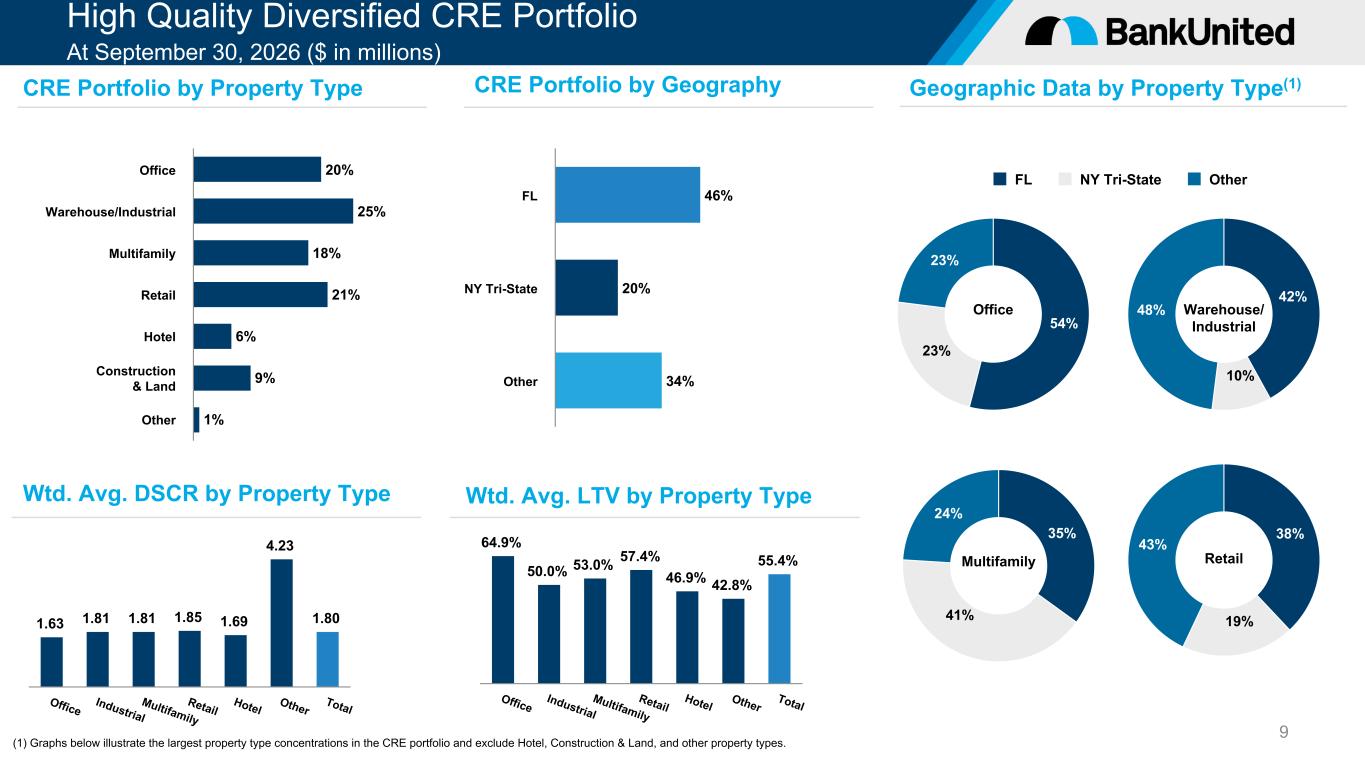
High Quality Diversified CRE Portfolio At September 30, 2026 ($ in millions) 9 20% 25% 18% 21% 6% 9% 1% Office Warehouse/Industrial Multifamily Retail Hotel Construction & Land Other 1.63 1.81 1.81 1.85 1.69 4.23 1.80 Office Industrial Multifamily Retail Hotel Other Total 64.9% 50.0% 53.0% 57.4% 46.9% 42.8% 55.4% Office Industrial Multifamily Retail Hotel Other Total CRE Portfolio by Property Type Wtd. Avg. DSCR by Property Type CRE Portfolio by Geography Geographic Data by Property Type(1) Wtd. Avg. LTV by Property Type 46% 20% 34% FL NY Tri-State Other 54% 23% 23% 42% 10% 48% 35% 41% 24% 38% 19% 43% Multifamily Retail Warehouse/ Industrial Office FL NY Tri-State Other (1) Graphs below illustrate the largest property type concentrations in the CRE portfolio and exclude Hotel, Construction & Land, and other property types.
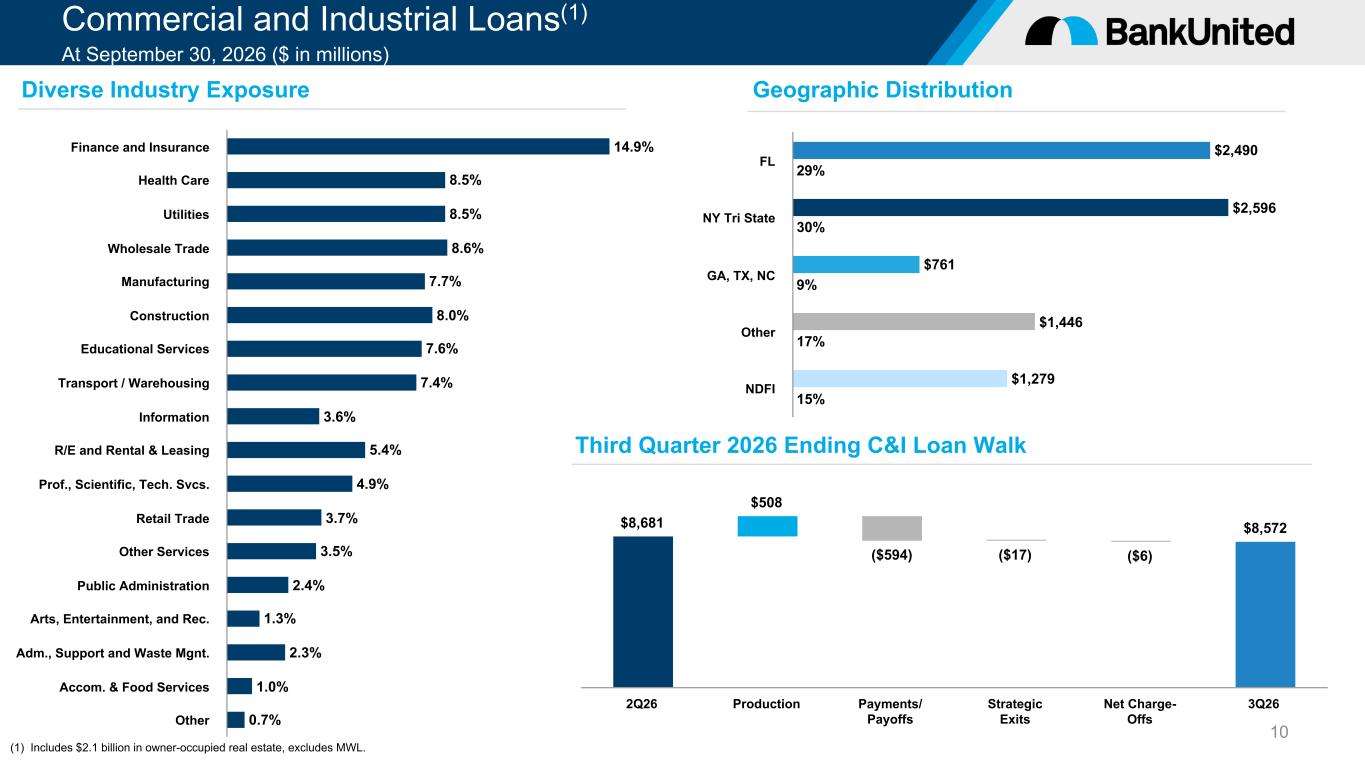
Commercial and Industrial Loans(1) At September 30, 2026 ($ in millions) 10 14.9% 8.5% 8.5% 8.6% 7.7% 8.0% 7.6% 7.4% 3.6% 5.4% 4.9% 3.7% 3.5% 2.4% 1.3% 2.3% 1.0% 0.7% Finance and Insurance Health Care Utilities Wholesale Trade Manufacturing Construction Educational Services Transport / Warehousing Information R/E and Rental & Leasing Prof., Scientific, Tech. Svcs. Retail Trade Other Services Public Administration Arts, Entertainment, and Rec. Adm., Support and Waste Mgnt. Accom. & Food Services Other $8,681 $508 ($594) ($17) ($6) $8,572 2Q26 Production Payments/ Payoffs Strategic Exits Net Charge- Offs 3Q26 Diverse Industry Exposure Geographic Distribution Third Quarter 2026 Ending C&I Loan Walk (1) Includes $2.1 billion in owner-occupied real estate, excludes MWL. $2,490 $2,596 $761 $1,446 $1,279 29% 30% 9% 17% 15% FL NY Tri State GA, TX, NC Other NDFI
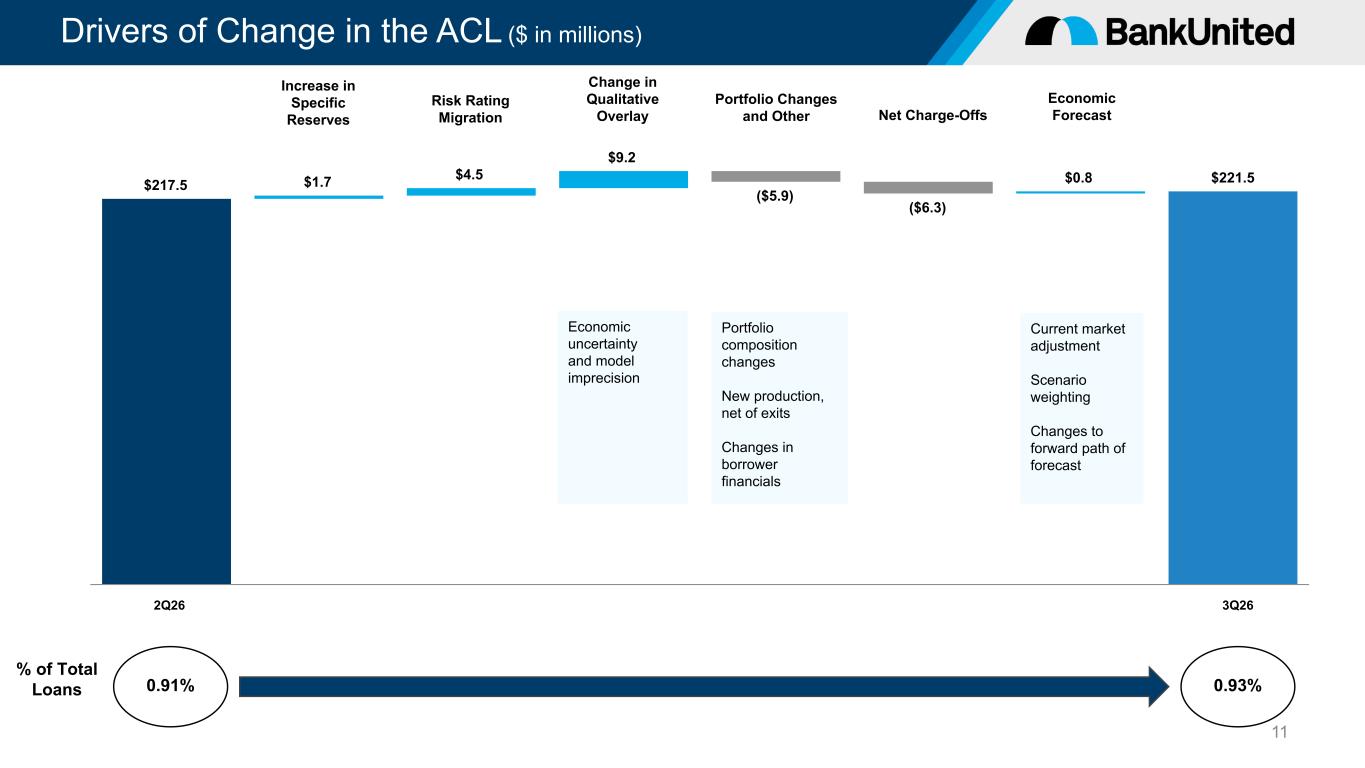
Drivers of Change in the ACL ($ in millions) 11 $217.5 $1.7 $4.5 $9.2 ($5.9) ($6.3) $0.8 $221.5 2Q26 3Q26 % of Total Loans 0.91% 0.93% Increase in Specific Reserves Risk Rating Migration Change in Qualitative Overlay Portfolio Changes and Other Net Charge-Offs Economic Forecast Current market adjustment Scenario weighting Changes to forward path of forecast Portfolio composition changes New production, net of exits Changes in borrower financials Economic uncertainty and model imprecision
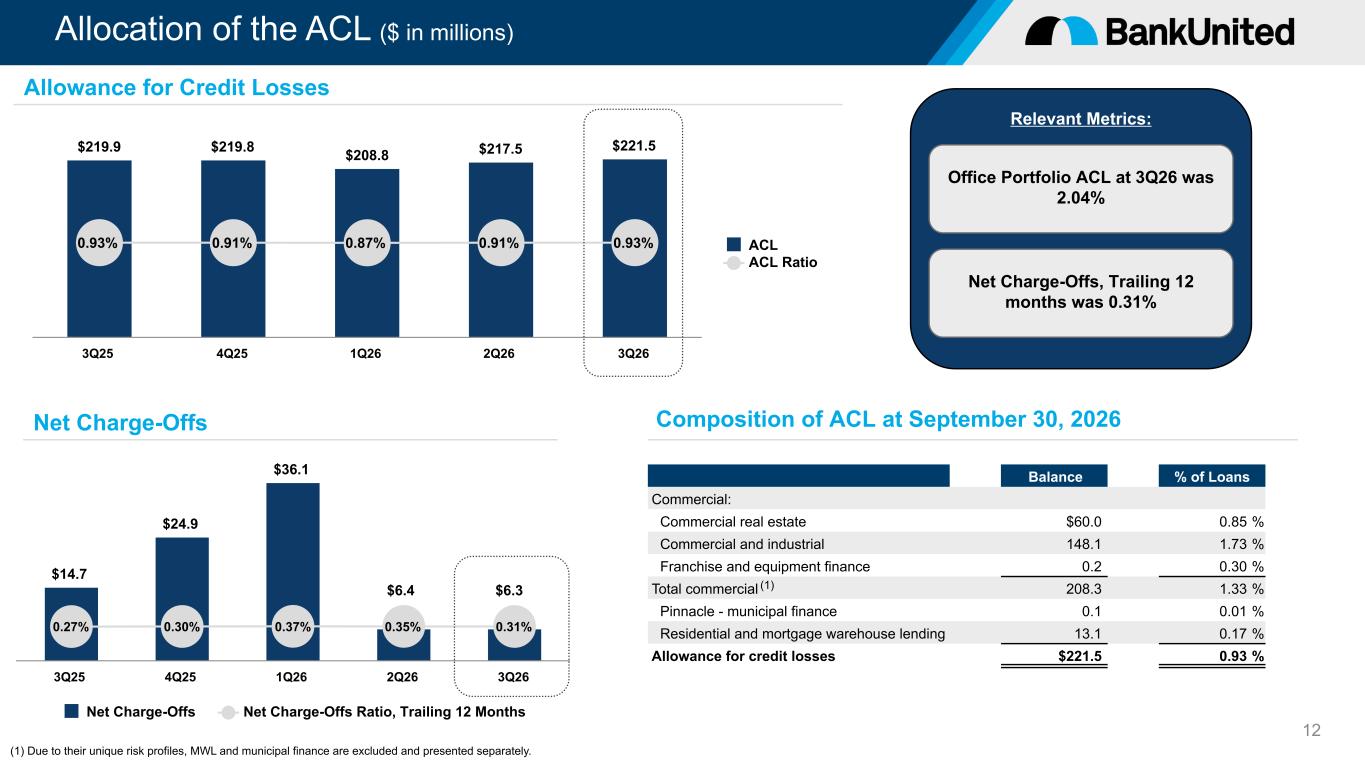
Relevant Metrics: Allocation of the ACL ($ in millions) 12 Office Portfolio ACL at 3Q26 was 2.04% $219.9 $219.8 $208.8 $217.5 $221.5 0.93% 0.91% 0.87% 0.91% 0.93% ACL ACL Ratio 3Q25 4Q25 1Q26 2Q26 3Q26 $14.7 $24.9 $36.1 0.27% 0.30% 0.37% 0.35% 0.31% Net Charge-Offs Net Charge-Offs Ratio, Trailing 12 Months 3Q25 4Q25 1Q26 2Q26 3Q26 Allowance for Credit Losses Net Charge-Offs Composition of ACL at September 30, 2026 Balance % of Loans Commercial: Commercial real estate $60.0 0.85 % Commercial and industrial 148.1 1.73 % Franchise and equipment finance 0.2 0.30 % Total commercial 208.3 1.33 % Pinnacle - municipal finance 0.1 0.01 % Residential and mortgage warehouse lending 13.1 0.17 % Allowance for credit losses $221.5 0.93 % Net Charge-Offs, Trailing 12 months was 0.31% $6.3$6.4 (1) (1) Due to their unique risk profiles, MWL and municipal finance are excluded and presented separately.
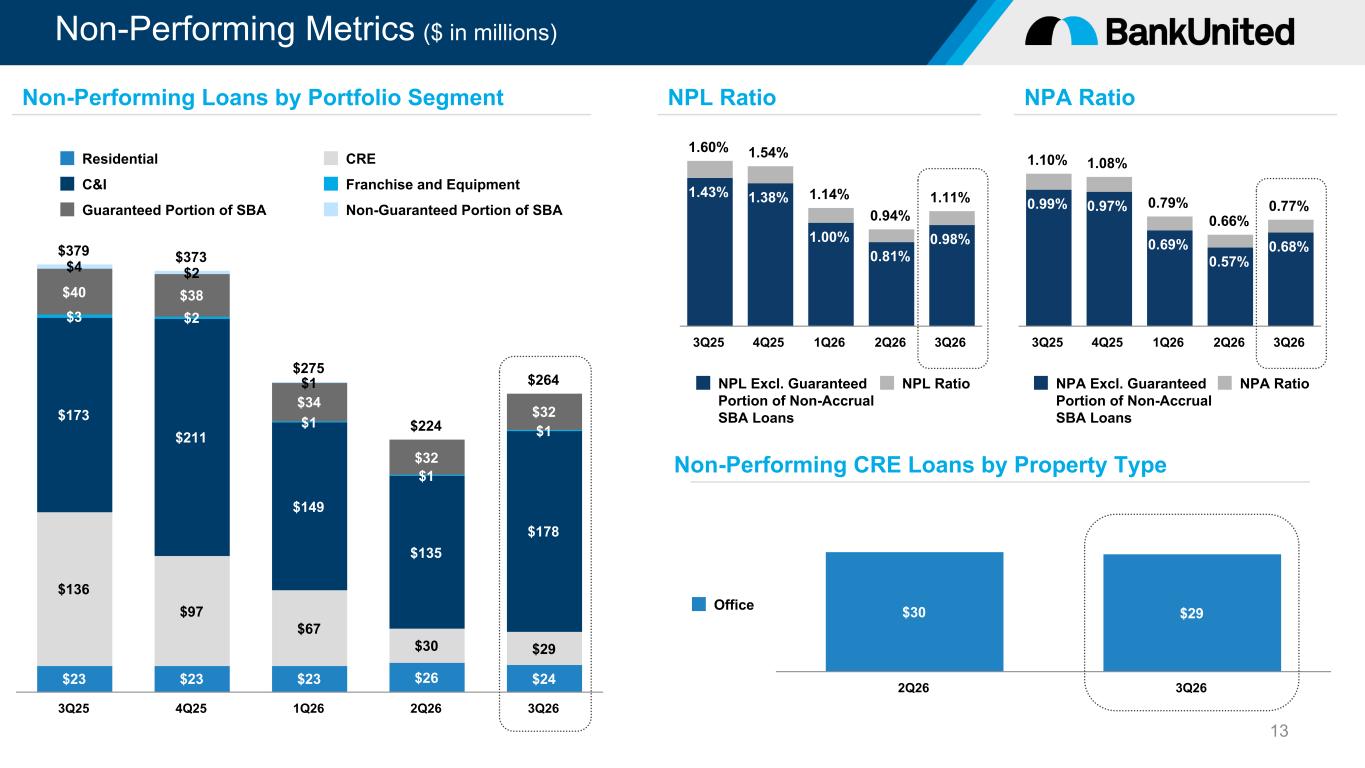
Non-Performing Metrics ($ in millions) 13 1.60% 1.54% 1.14% 0.94% 1.11%1.43% 1.38% 1.00% 0.81% 0.98% NPL Excl. Guaranteed Portion of Non-Accrual SBA Loans NPL Ratio 3Q25 4Q25 1Q26 2Q26 3Q26 NPL RatioNon-Performing Loans by Portfolio Segment $379 $373 $275 $224 $264 $23 $23 $23 $26 $24 $136 $97 $67 $30 $29 $173 $211 $149 $135 $178 $3 $2 $1 $1 $1 $40 $38 $34 $32 $32 $4 $2 $1 Residential CRE C&I Franchise and Equipment Guaranteed Portion of SBA Non-Guaranteed Portion of SBA 3Q25 4Q25 1Q26 2Q26 3Q26 1.10% 1.08% 0.79% 0.66% 0.77%0.99% 0.97% 0.69% 0.57% 0.68% NPA Excl. Guaranteed Portion of Non-Accrual SBA Loans NPA Ratio 3Q25 4Q25 1Q26 2Q26 3Q26 NPA Ratio Non-Performing CRE Loans by Property Type $30 $29Office 2Q26 3Q26
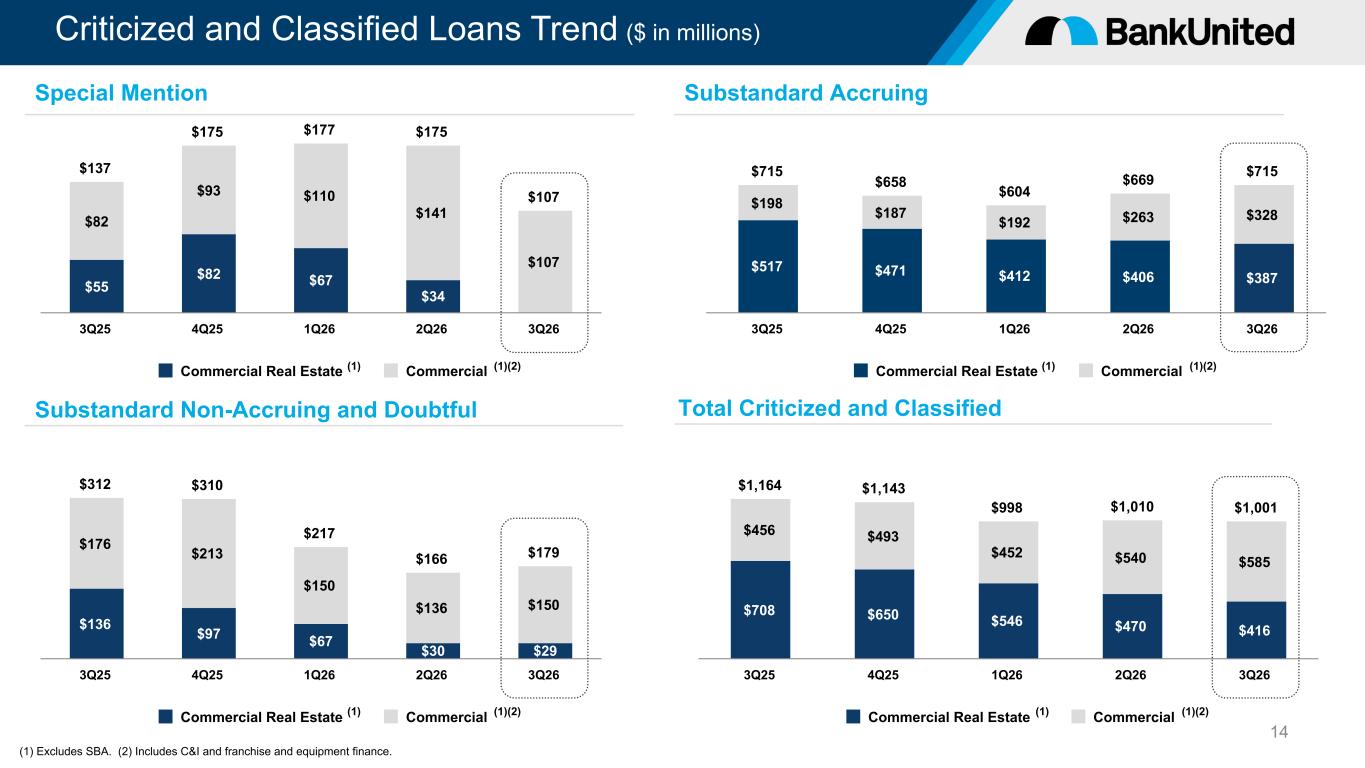
Criticized and Classified Loans Trend ($ in millions) 14 $137 $175 $177 $175 $107 $55 $82 $67 $34 $82 $93 $110 $141 $107 Commercial Real Estate Commercial 3Q25 4Q25 1Q26 2Q26 3Q26 $312 $310 $217 $166 $179 $136 $97 $67 $30 $29 $176 $213 $150 $136 $150 Commercial Real Estate Commercial 3Q25 4Q25 1Q26 2Q26 3Q26 (1) Excludes SBA. (2) Includes C&I and franchise and equipment finance. Special Mention Substandard Non-Accruing and Doubtful $715 $658 $604 $669 $715 $517 $471 $412 $406 $387 $198 $187 $192 $263 $328 Commercial Real Estate Commercial 3Q25 4Q25 1Q26 2Q26 3Q26 $1,164 $1,143 $998 $1,010 $1,001 $708 $650 $546 $470 $416 $456 $493 $452 $540 $585 Commercial Real Estate Commercial 3Q25 4Q25 1Q26 2Q26 3Q26 Total Criticized and Classified Substandard Accruing (1) (1)(2) (1) (1)(2) (1) (1)(2) (1) (1)(2)
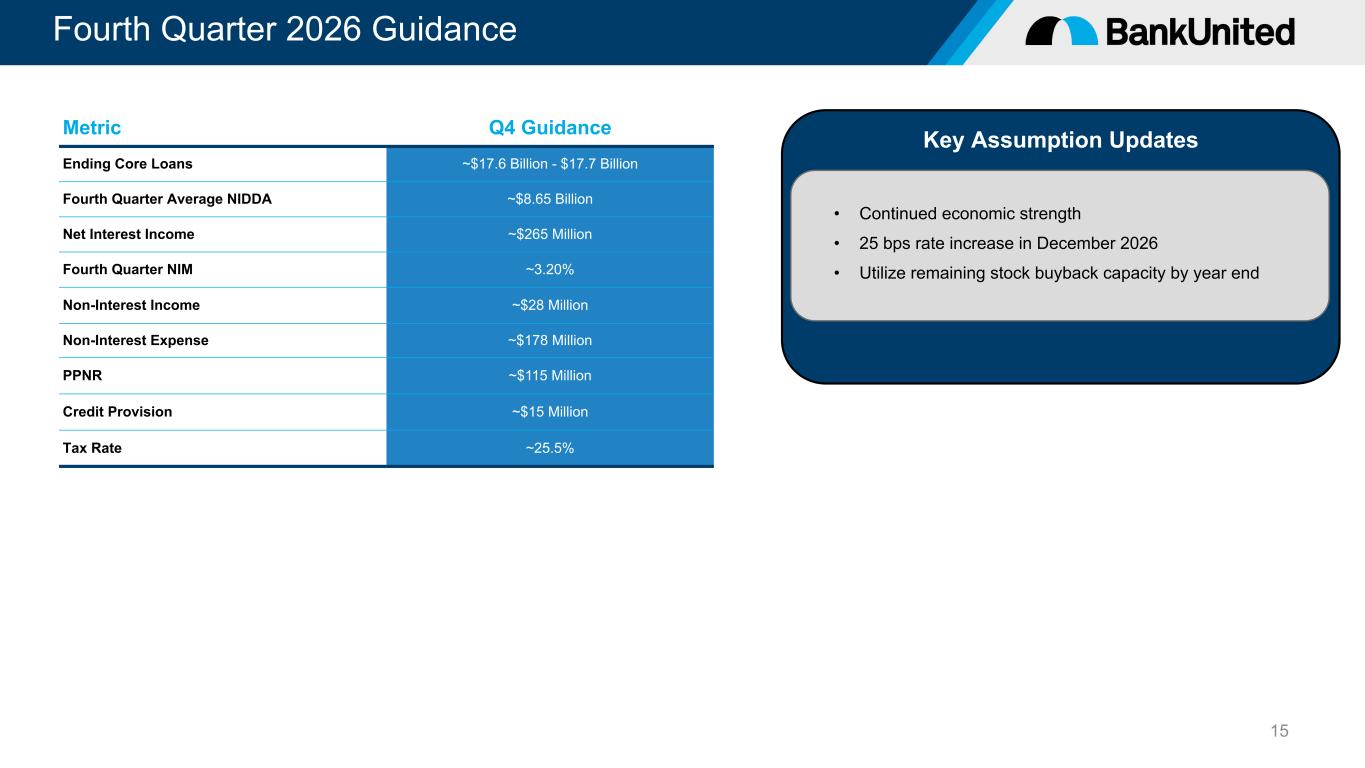
Fourth Quarter 2026 Guidance 15 Key Assumption Updates • Continued economic strength • 25 bps rate increase in December 2026 • Utilize remaining stock buyback capacity by year end Metric Q4 Guidance Ending Core Loans ~$17.6 Billion - $17.7 Billion Fourth Quarter Average NIDDA ~$8.65 Billion Net Interest Income ~$265 Million Fourth Quarter NIM ~3.20% Non-Interest Income ~$28 Million Non-Interest Expense ~$178 Million PPNR ~$115 Million Credit Provision ~$15 Million Tax Rate ~25.5%
Appendix
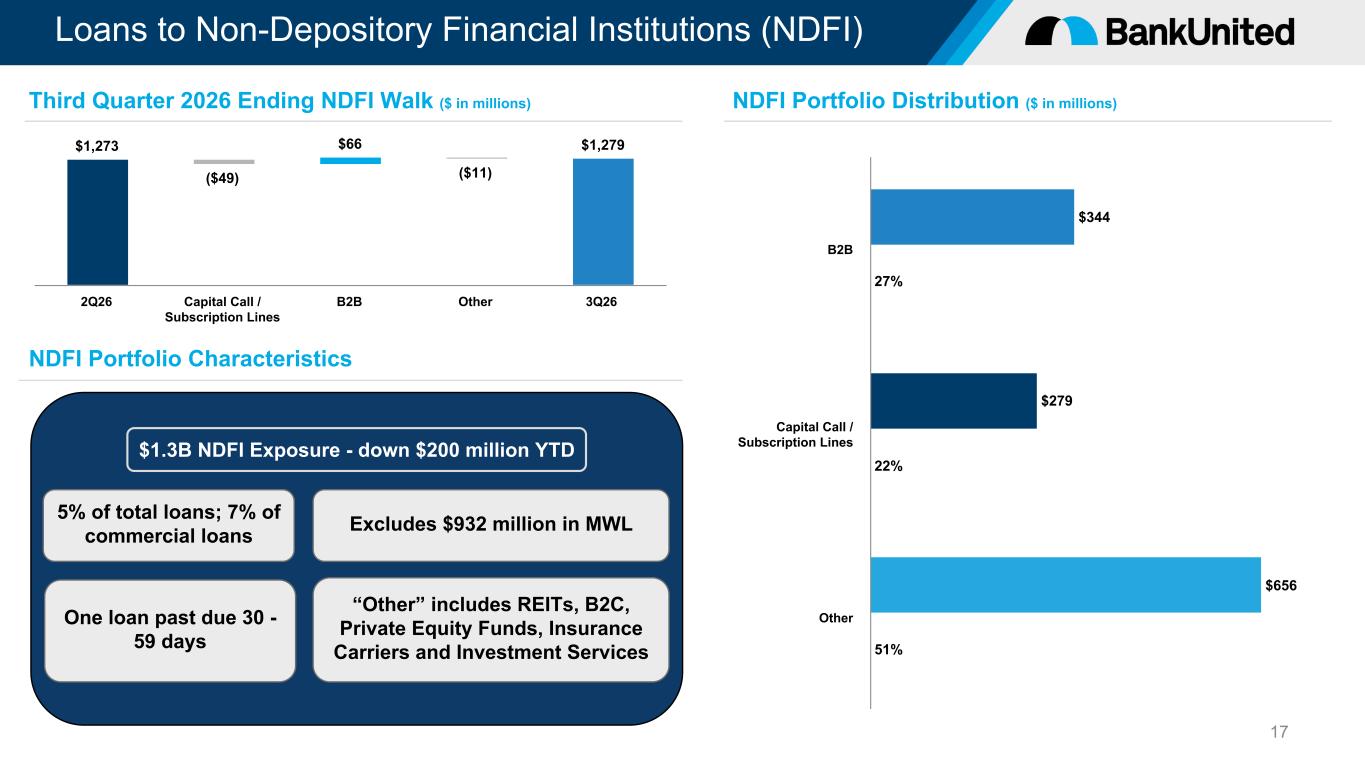
$1.3B NDFI Exposure - down $200 million YTD Loans to Non-Depository Financial Institutions (NDFI) 17 “Other” includes REITs, B2C, Private Equity Funds, Insurance Carriers and Investment Services NDFI Portfolio Characteristics 5% of total loans; 7% of commercial loans One loan past due 30 - 59 days Excludes $932 million in MWL $1,273 ($49) $66 ($11) $1,279 2Q26 Capital Call / Subscription Lines B2B Other 3Q26 Third Quarter 2026 Ending NDFI Walk ($ in millions) NDFI Portfolio Distribution ($ in millions) $344 $279 $656 27% 22% 51% B2B Capital Call / Subscription Lines Other
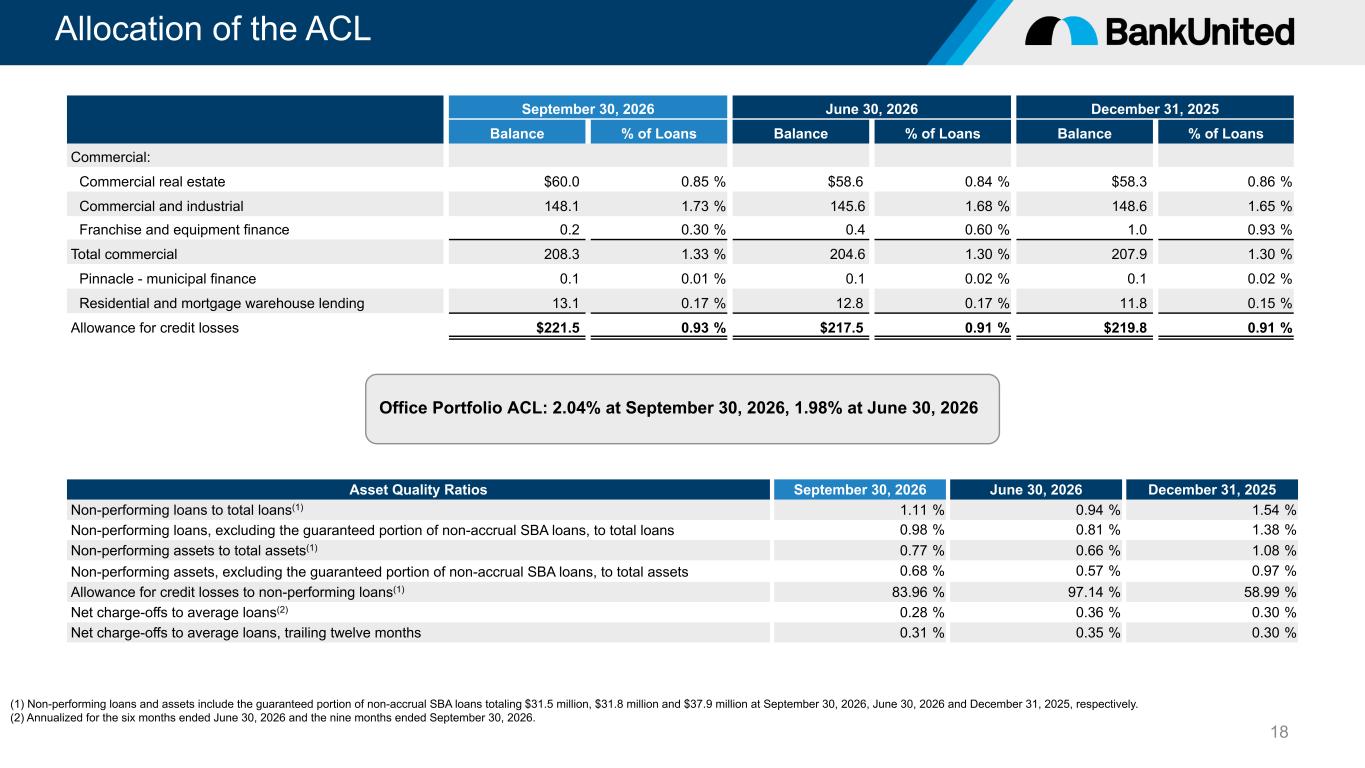
Allocation of the ACL 18 September 30, 2026 June 30, 2026 December 31, 2025 Balance % of Loans Balance % of Loans Balance % of Loans Commercial: Commercial real estate $60.0 0.85 % $58.6 0.84 % $58.3 0.86 % Commercial and industrial 148.1 1.73 % 145.6 1.68 % 148.6 1.65 % Franchise and equipment finance 0.2 0.30 % 0.4 0.60 % 1.0 0.93 % Total commercial 208.3 1.33 % 204.6 1.30 % 207.9 1.30 % Pinnacle - municipal finance 0.1 0.01 % 0.1 0.02 % 0.1 0.02 % Residential and mortgage warehouse lending 13.1 0.17 % 12.8 0.17 % 11.8 0.15 % Allowance for credit losses $221.5 0.93 % $217.5 0.91 % $219.8 0.91 % Office Portfolio ACL: 2.04% at September 30, 2026, 1.98% at June 30, 2026 Asset Quality Ratios September 30, 2026 June 30, 2026 December 31, 2025 Non-performing loans to total loans(1) 1.11 % 0.94 % 1.54 % Non-performing loans, excluding the guaranteed portion of non-accrual SBA loans, to total loans 0.98 % 0.81 % 1.38 % Non-performing assets to total assets(1) 0.77 % 0.66 % 1.08 % Non-performing assets, excluding the guaranteed portion of non-accrual SBA loans, to total assets 0.68 % 0.57 % 0.97 % Allowance for credit losses to non-performing loans(1) 83.96 % 97.14 % 58.99 % Net charge-offs to average loans(2) 0.28 % 0.36 % 0.30 % Net charge-offs to average loans, trailing twelve months 0.31 % 0.35 % 0.30 % (1) Non-performing loans and assets include the guaranteed portion of non-accrual SBA loans totaling $31.5 million, $31.8 million and $37.9 million at September 30, 2026, June 30, 2026 and December 31, 2025, respectively. (2) Annualized for the six months ended June 30, 2026 and the nine months ended September 30, 2026.
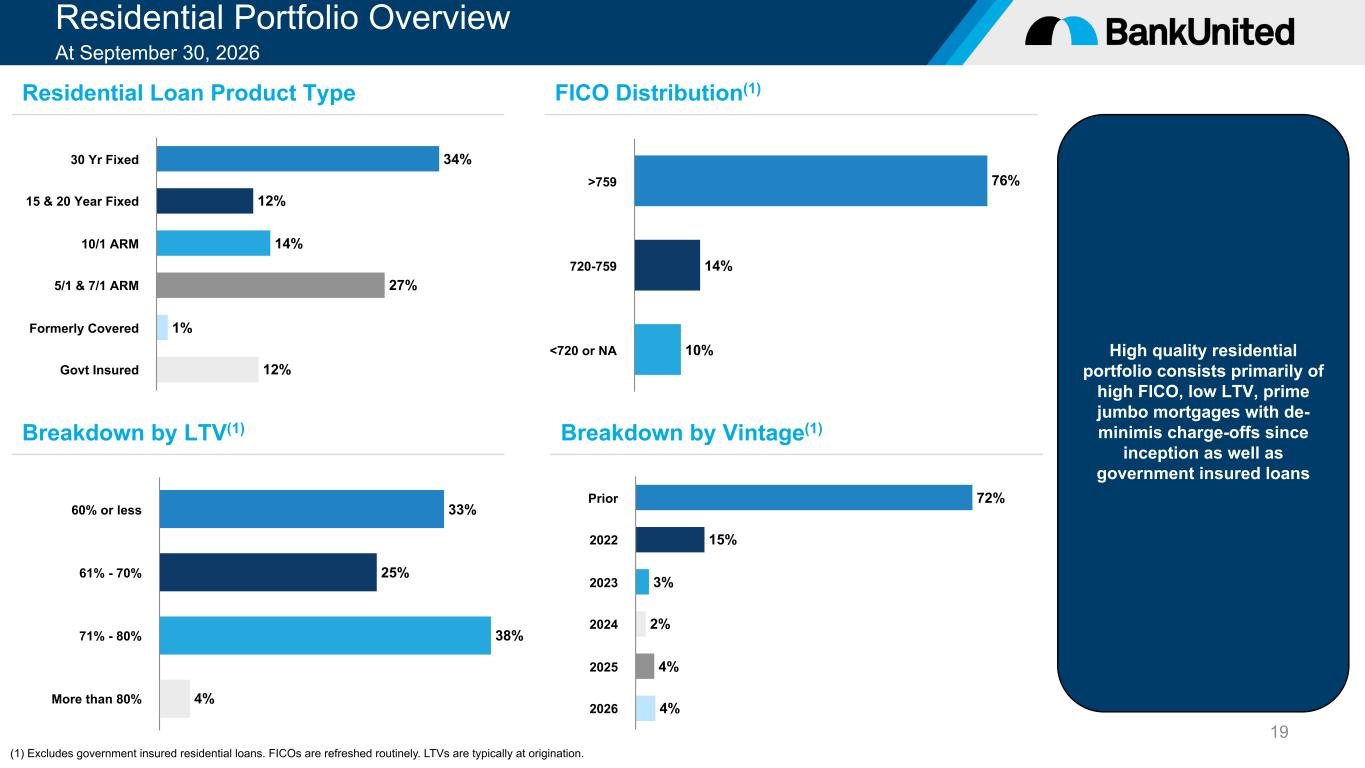
Residential Portfolio Overview At September 30, 2026 19 High quality residential portfolio consists primarily of high FICO, low LTV, prime jumbo mortgages with de- minimis charge-offs since inception as well as government insured loans (1) Excludes government insured residential loans. FICOs are refreshed routinely. LTVs are typically at origination. Residential Loan Product Type Breakdown by LTV(1) FICO Distribution(1) Breakdown by Vintage(1) 34% 12% 14% 27% 1% 12% 30 Yr Fixed 15 & 20 Year Fixed 10/1 ARM 5/1 & 7/1 ARM Formerly Covered Govt Insured 76% 14% 10% >759 720-759 <720 or NA 33% 25% 38% 4% 60% or less 61% - 70% 71% - 80% More than 80% 72% 15% 3% 2% 4% 4% Prior 2022 2023 2024 2025 2026
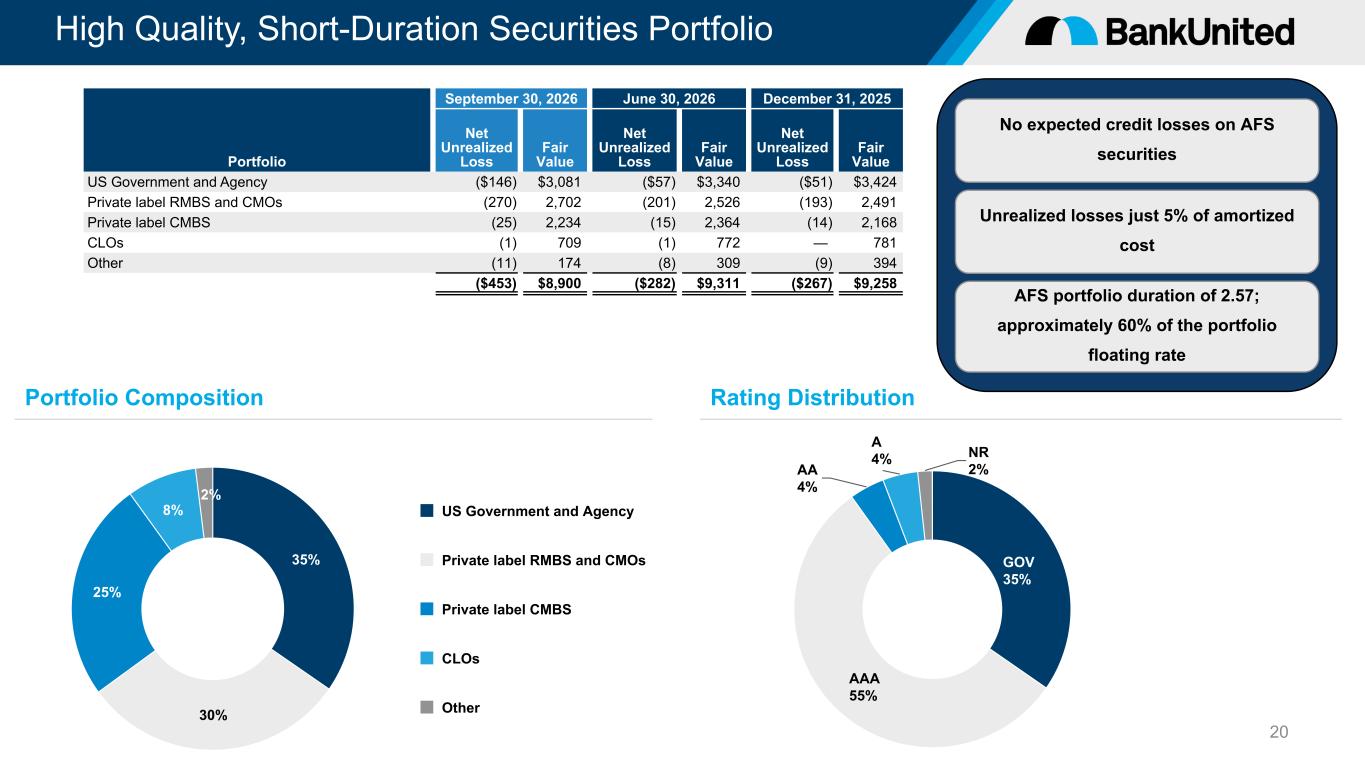
Unrealized losses just 5% of amortized cost No expected credit losses on AFS securities High Quality, Short-Duration Securities Portfolio 20 35% 30% 25% 8% 2% US Government and Agency Private label RMBS and CMOs Private label CMBS CLOs Other GOV 35% AAA 55% AA 4% A 4% NR 2% September 30, 2026 June 30, 2026 December 31, 2025 Portfolio Net Unrealized Loss Fair Value Net Unrealized Loss Fair Value Net Unrealized Loss Fair Value US Government and Agency ($146) $3,081 ($57) $3,340 ($51) $3,424 Private label RMBS and CMOs (270) 2,702 (201) 2,526 (193) 2,491 Private label CMBS (25) 2,234 (15) 2,364 (14) 2,168 CLOs (1) 709 (1) 772 — 781 Other (11) 174 (8) 309 (9) 394 ($453) $8,900 ($282) $9,311 ($267) $9,258 Portfolio Composition Rating Distribution AFS portfolio duration of 2.57; approximately 60% of the portfolio floating rate
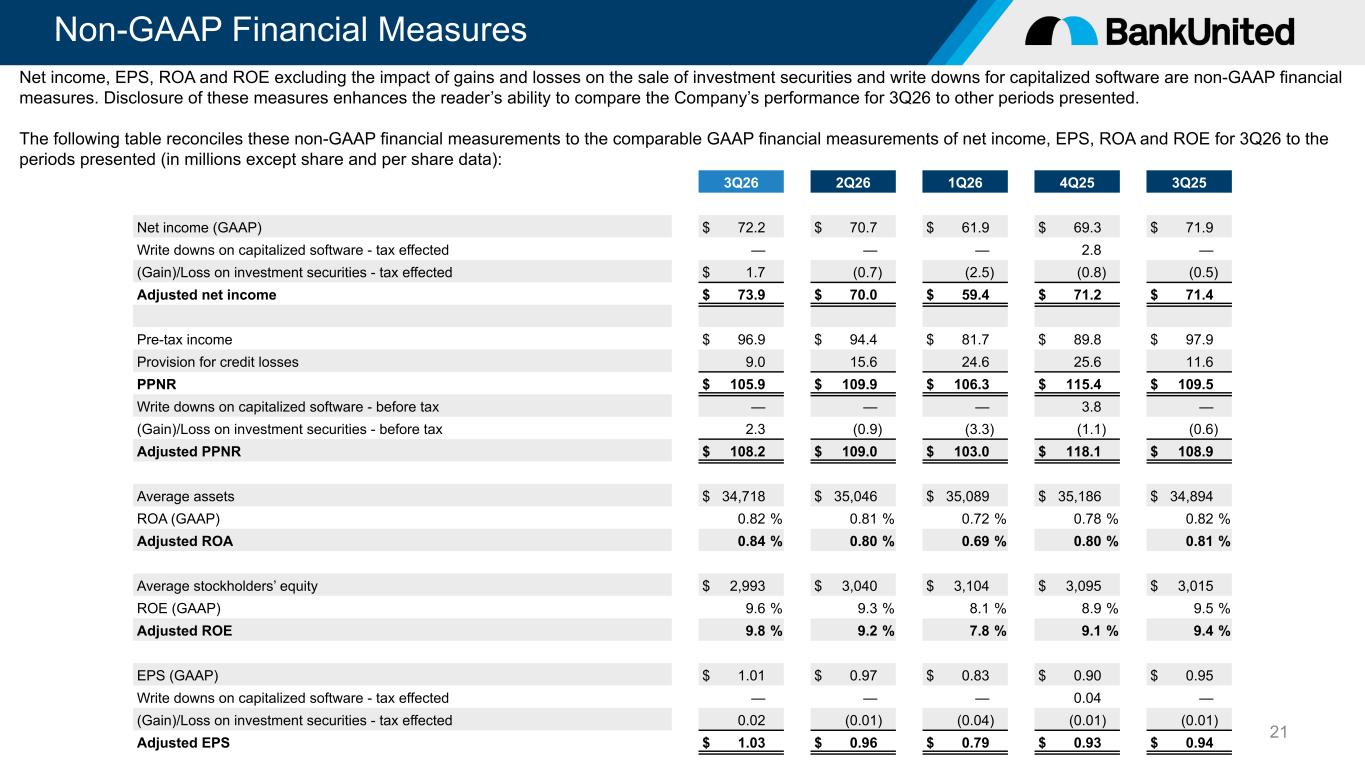
Non-GAAP Financial Measures 21 3Q26 2Q26 1Q26 4Q25 3Q25 Net income (GAAP) $ 72.2 $ 70.7 $ 61.9 $ 69.3 $ 71.9 Write downs on capitalized software - tax effected — — — 2.8 — (Gain)/Loss on investment securities - tax effected $ 1.7 (0.7) (2.5) (0.8) (0.5) Adjusted net income $ 73.9 $ 70.0 $ 59.4 $ 71.2 $ 71.4 Pre-tax income $ 96.9 $ 94.4 $ 81.7 $ 89.8 $ 97.9 Provision for credit losses 9.0 15.6 24.6 25.6 11.6 PPNR $ 105.9 $ 109.9 $ 106.3 $ 115.4 $ 109.5 Write downs on capitalized software - before tax — — — 3.8 — (Gain)/Loss on investment securities - before tax 2.3 (0.9) (3.3) (1.1) (0.6) Adjusted PPNR $ 108.2 $ 109.0 $ 103.0 $ 118.1 $ 108.9 Average assets $ 34,718 $ 35,046 $ 35,089 $ 35,186 $ 34,894 ROA (GAAP) 0.82 % 0.81 % 0.72 % 0.78 % 0.82 % Adjusted ROA 0.84 % 0.80 % 0.69 % 0.80 % 0.81 % Average stockholders’ equity $ 2,993 $ 3,040 $ 3,104 $ 3,095 $ 3,015 ROE (GAAP) 9.6 % 9.3 % 8.1 % 8.9 % 9.5 % Adjusted ROE 9.8 % 9.2 % 7.8 % 9.1 % 9.4 % EPS (GAAP) $ 1.01 $ 0.97 $ 0.83 $ 0.90 $ 0.95 Write downs on capitalized software - tax effected — — — 0.04 — (Gain)/Loss on investment securities - tax effected 0.02 (0.01) (0.04) (0.01) (0.01) Adjusted EPS $ 1.03 $ 0.96 $ 0.79 $ 0.93 $ 0.94 Net income, EPS, ROA and ROE excluding the impact of gains and losses on the sale of investment securities and write downs for capitalized software are non-GAAP financial measures. Disclosure of these measures enhances the reader’s ability to compare the Company’s performance for 3Q26 to other periods presented. The following table reconciles these non-GAAP financial measurements to the comparable GAAP financial measurements of net income, EPS, ROA and ROE for 3Q26 to the periods presented (in millions except share and per share data):
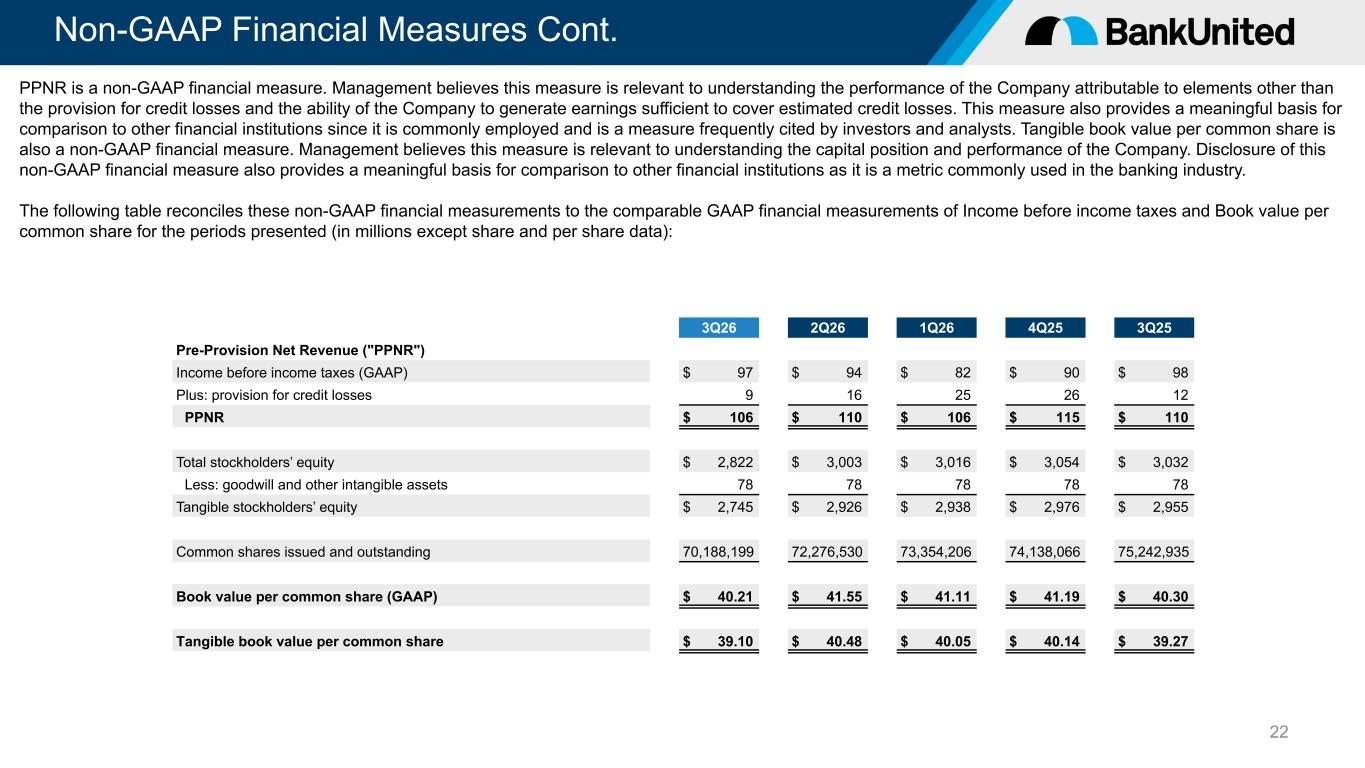
Non-GAAP Financial Measures Cont. 22 PPNR is a non-GAAP financial measure. Management believes this measure is relevant to understanding the performance of the Company attributable to elements other than the provision for credit losses and the ability of the Company to generate earnings sufficient to cover estimated credit losses. This measure also provides a meaningful basis for comparison to other financial institutions since it is commonly employed and is a measure frequently cited by investors and analysts. Tangible book value per common share is also a non-GAAP financial measure. Management believes this measure is relevant to understanding the capital position and performance of the Company. Disclosure of this non-GAAP financial measure also provides a meaningful basis for comparison to other financial institutions as it is a metric commonly used in the banking industry. The following table reconciles these non-GAAP financial measurements to the comparable GAAP financial measurements of Income before income taxes and Book value per common share for the periods presented (in millions except share and per share data): 3Q26 2Q26 1Q26 4Q25 3Q25 Pre-Provision Net Revenue ("PPNR") Income before income taxes (GAAP) $ 97 $ 94 $ 82 $ 90 $ 98 Plus: provision for credit losses 9 16 25 26 12 PPNR $ 106 $ 110 $ 106 $ 115 $ 110 Total stockholders’ equity $ 2,822 $ 3,003 $ 3,016 $ 3,054 $ 3,032 Less: goodwill and other intangible assets 78 78 78 78 78 Tangible stockholders’ equity $ 2,745 $ 2,926 $ 2,938 $ 2,976 $ 2,955 Common shares issued and outstanding 70,188,199 72,276,530 73,354,206 74,138,066 75,242,935 Book value per common share (GAAP) $ 40.21 $ 41.55 $ 41.11 $ 41.19 $ 40.30 Tangible book value per common share $ 39.10 $ 40.48 $ 40.05 $ 40.14 $ 39.27